


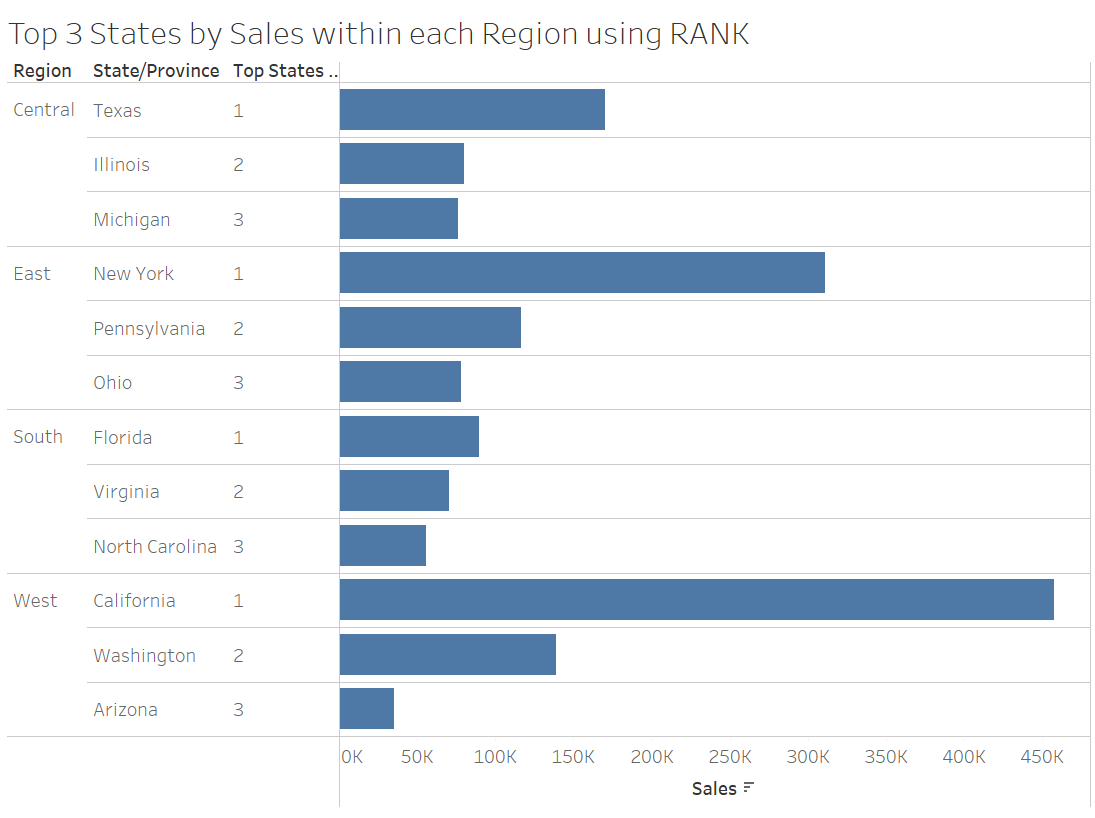
A step by step for how to build a chart that shows the top 3 states within each region. There are various way to do it but we will use the table calculation RANK to create this.
Firstly, drag 'Region' onto Rows and 'Sales' onto Columns. Clicking the small plus button, expand the 'Region' so it shows the 'States/Province' (a much quicker way of getting the States without dragging the field from the data pane!). Sort your bar chart by descending order.
Next, we need to rank each State so that we can return only the top 3 states within each region. For this we will use the table calculation: RANK. This function gives each row a whole number, either in ascending or descending order.
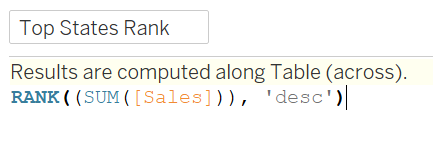
In the calculated field, we will use the RANK function. Formulate the calculation as seen below. The calculated field is stating that we want to rank each row by the SUM([Sales]) in descending order.
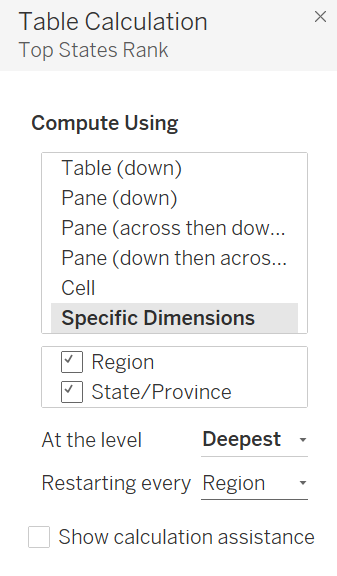
Then, drag the newly created calculated field to the Columns shelf and right-click and select 'Edit Table Calculation'. We need to make sure that it has been computed correctly so that we are getting the results we require. Select 'Specific Dimensions' and uncheck 'Region' (both will originally be ticked). Unchecking the box means that the calculation will restart every time it gets to a new region.
Another way of ensuring that the calculations reset every region is by keeping all the boxes within the 'Specific Dimensions' checked, which then provides you with more options - 'At the level' and 'Restarting every'. Change the options of the 'Restarting every' to 'Region' (and make sure that you have dragged Region above State/Province so that this option becomes available to select).
Now that we know the table calculation has been edited correctly, we need to return just the top 3 states. Simply, drag the table calculation in the shelf that we just edited to the filter shelf and show the filter. Then select the top 3 states and here we have created the view we are trying to build.