Today, the brief was similar to yesterday's but with an emphasis on thinking about more interesting charts to present the data.
As usual, I created a detailed plan but one of my goals for today was to ensure that I had made a list of questions that I wanted to answer. This was so that I did not let the data lead me and I was more focused about the questions I wanted to answer. I felt much better when I finally entered tableau and I knew what I wanted to look at.
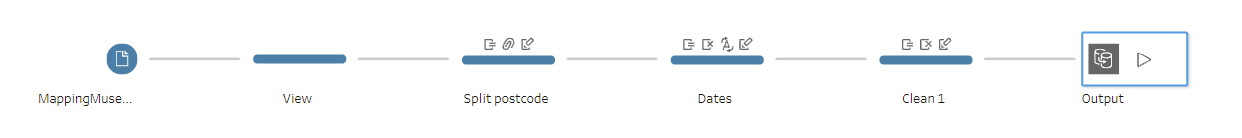
Below is an image of the data prep I did today. Thankfully, it was simple so I was able to stick to my plan very well at this point.
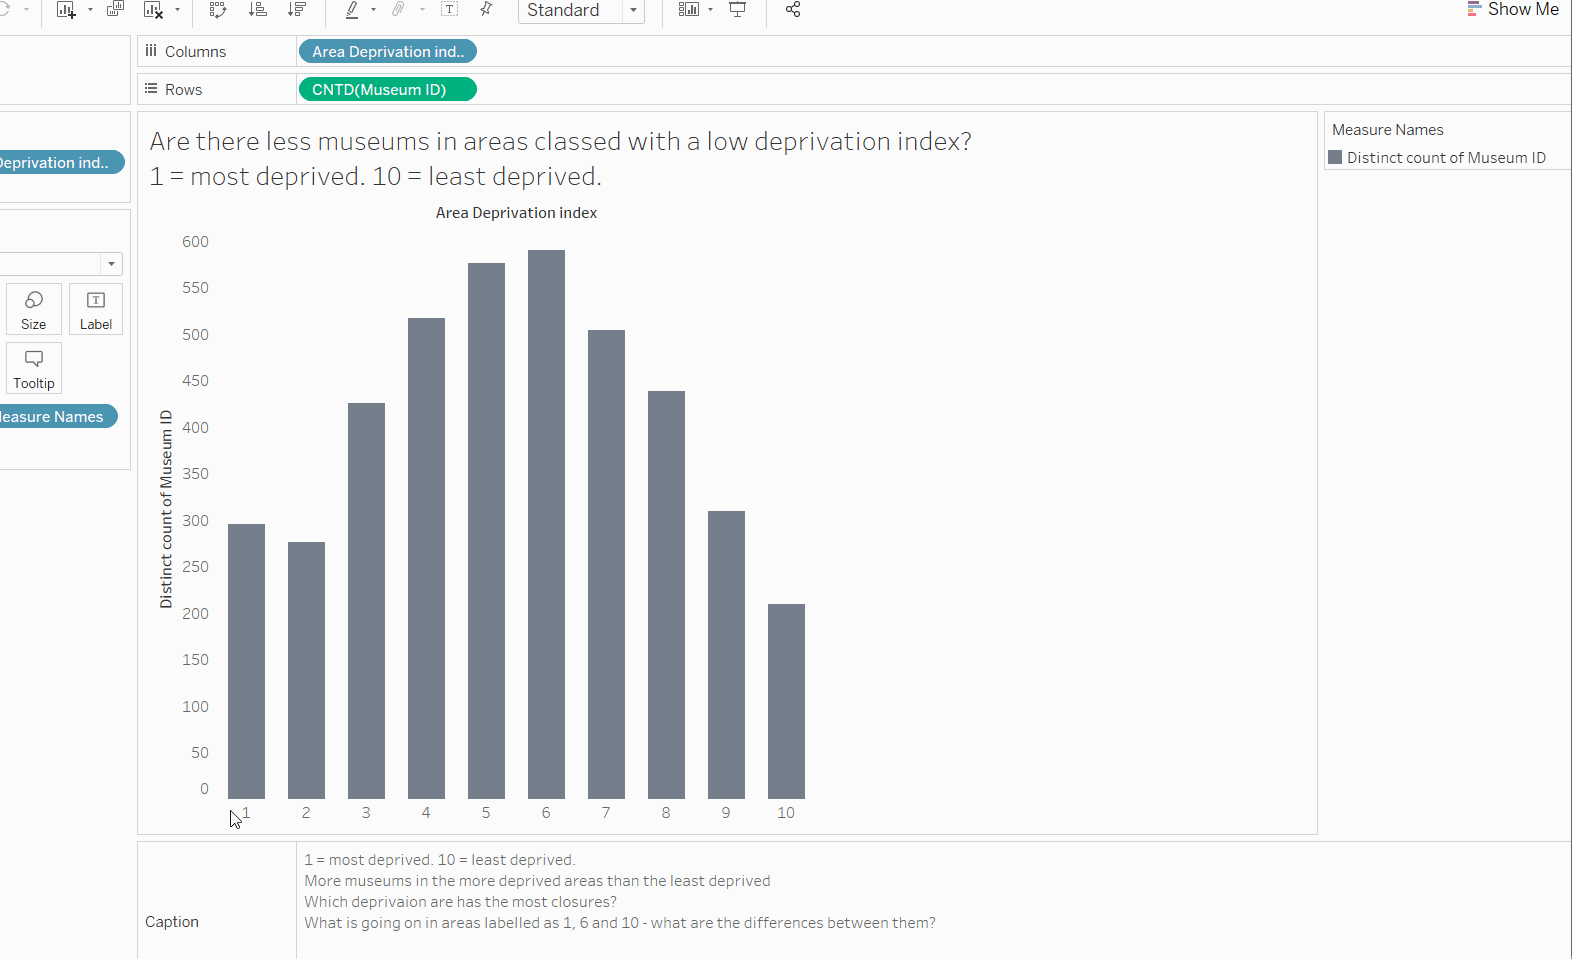
Below is an image of the views I created to drive my analysis. Building upon yesterday's feedback, I really tried to focus on an interesting point within the dataset and continually ask 'why?' something may be showing within the data.
After these two analysis based brief's, my next goal is to focus more on building interesting charts to present the data in a better way.