The brief we were given today was focused on drawing out analysis and insights from the dataset we chose (and bonus if we created a dashboard). We had 2 datasets to pick from and I chose the 'Annual Database of Global Wine Markets, 1835 to 2018'. I started off by creating my plan for the day which I didn't stick to as closely as I should have done (spent too long on data prep) and this led to some stress later on in the day when it come to gathering analysis.

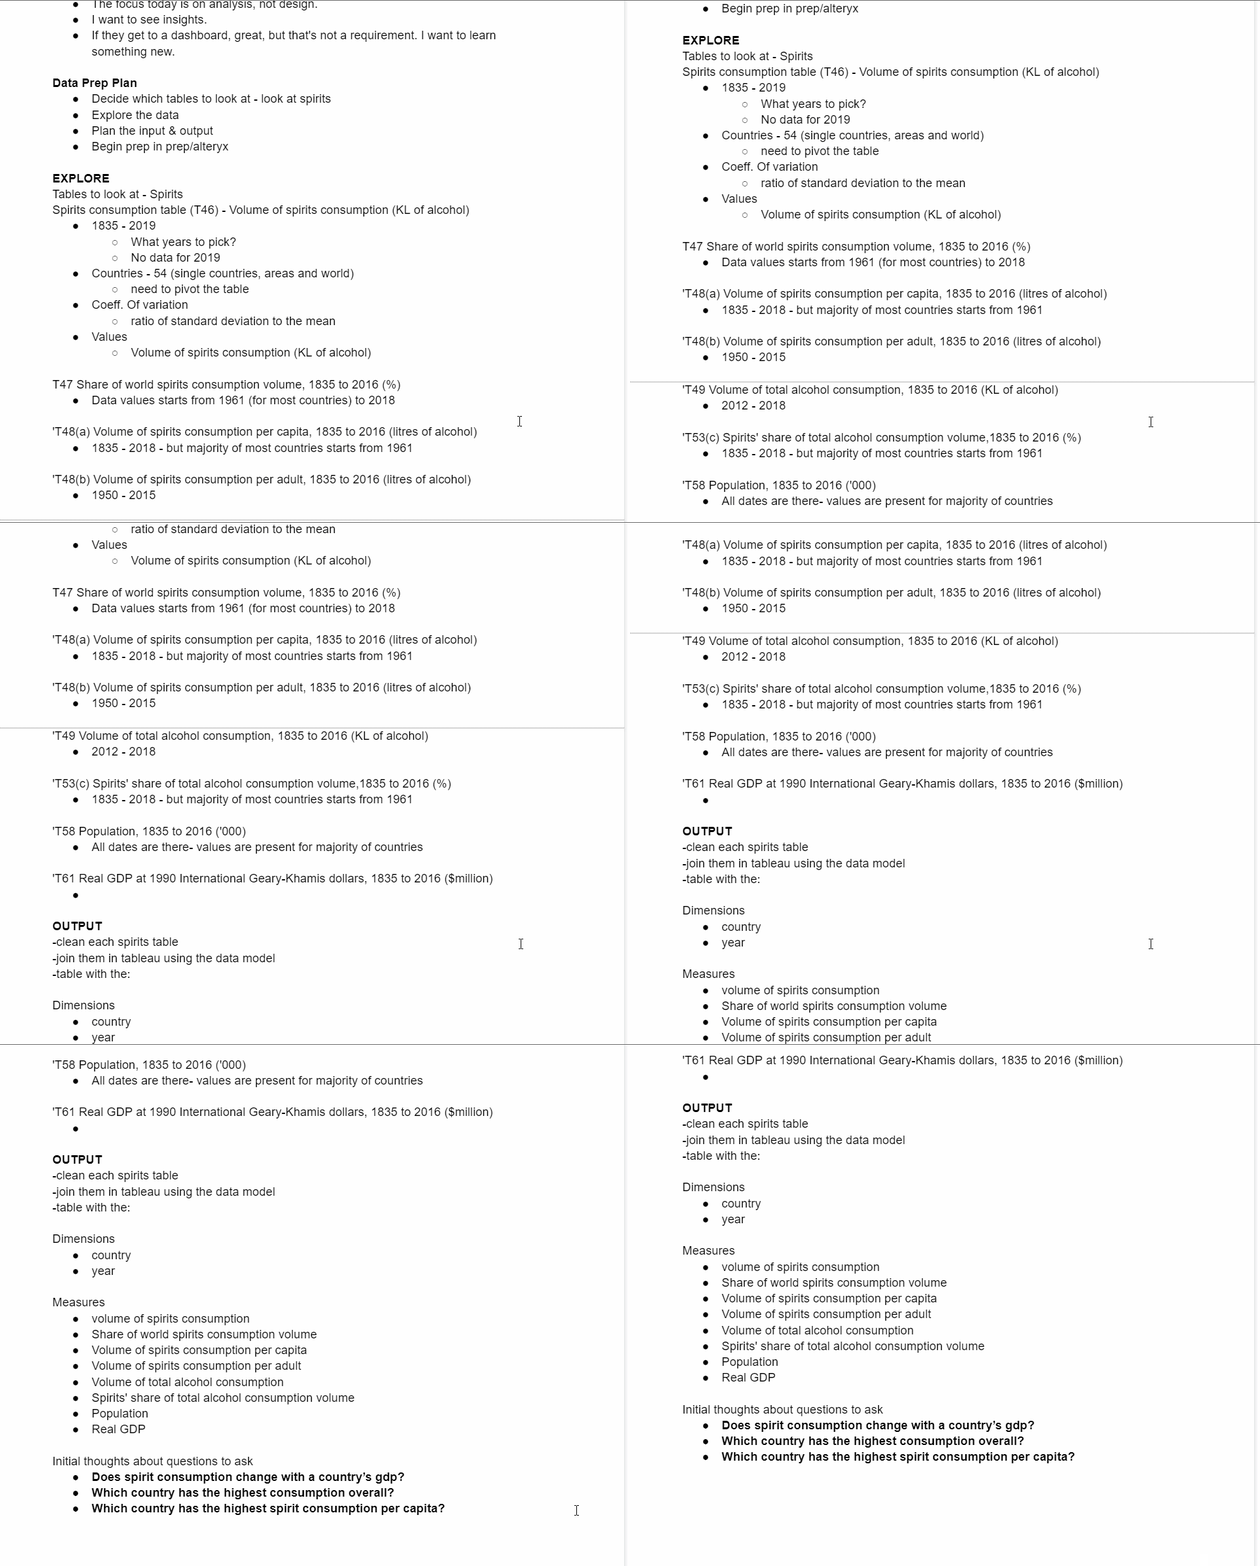
After creating my plan, I then planned out the data prep so that I would have a clearer idea of how I want my output to look like. This is something that I will continue to do in the future as it really simplifies the data prep and helps me get a better picture of how the whole process will go.
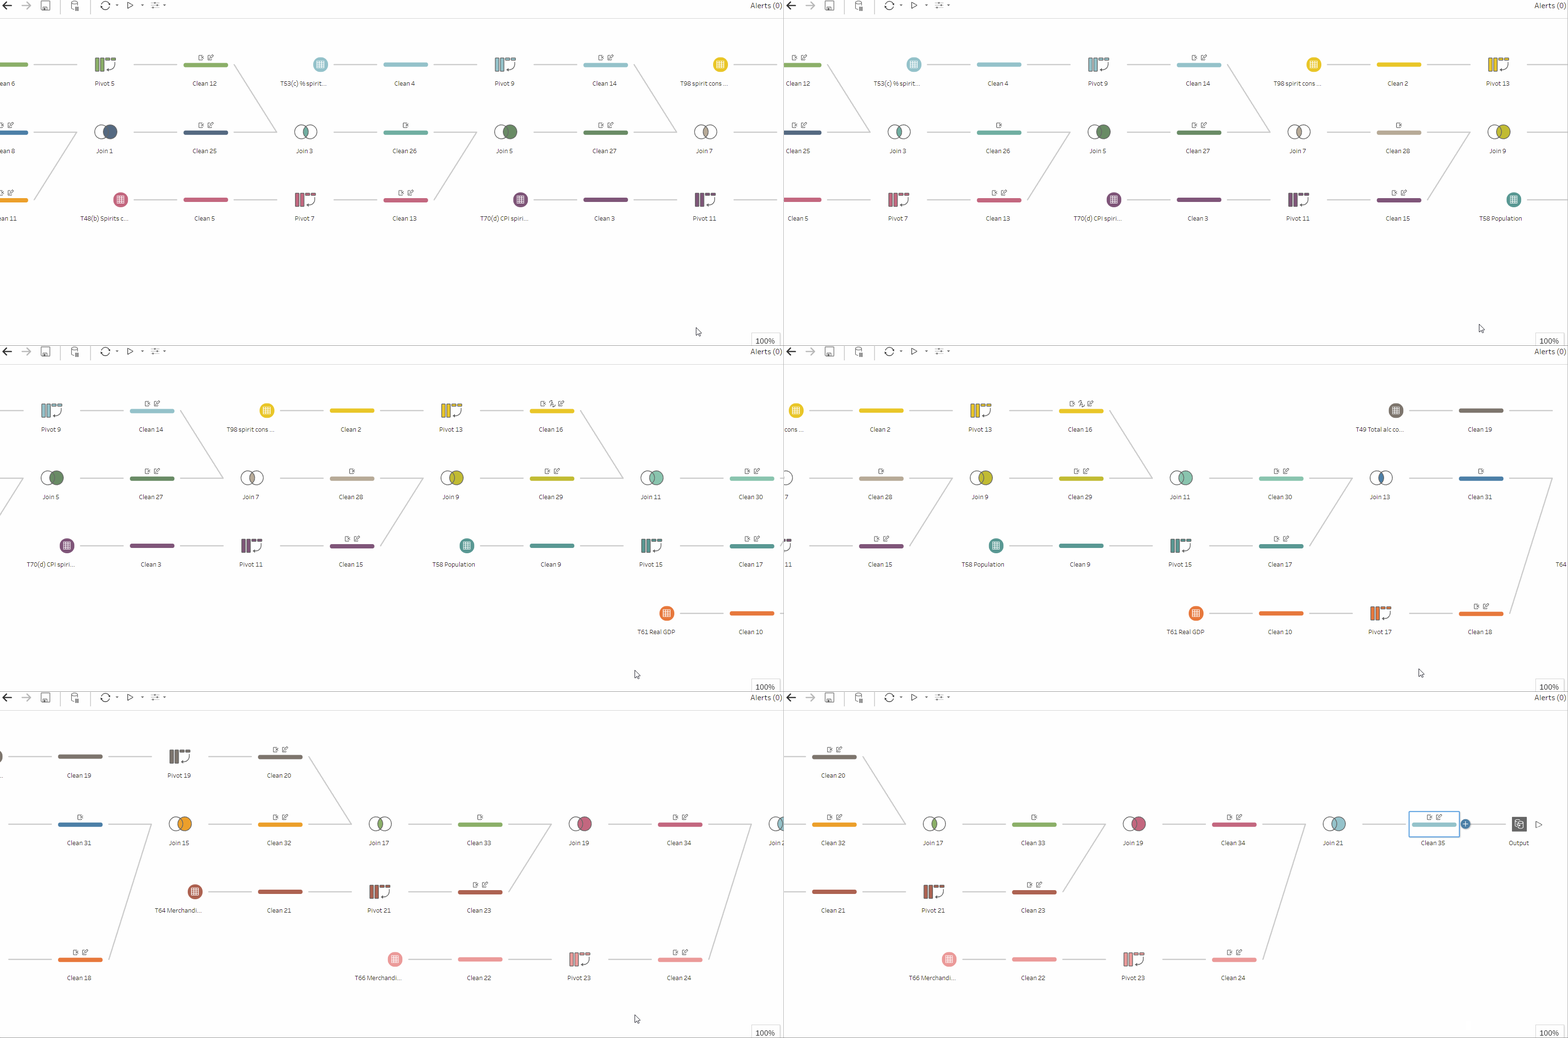
When I finally downloaded the dataset to start the exploration, there were so many sheets (over 100+) that I had to decide what overall topic I wanted to look at. I chose to look at information about spirits. However, one thing which impacted my timing was trying to join all the tables together as opposed to really sitting down and thinking about what tables I really needed.

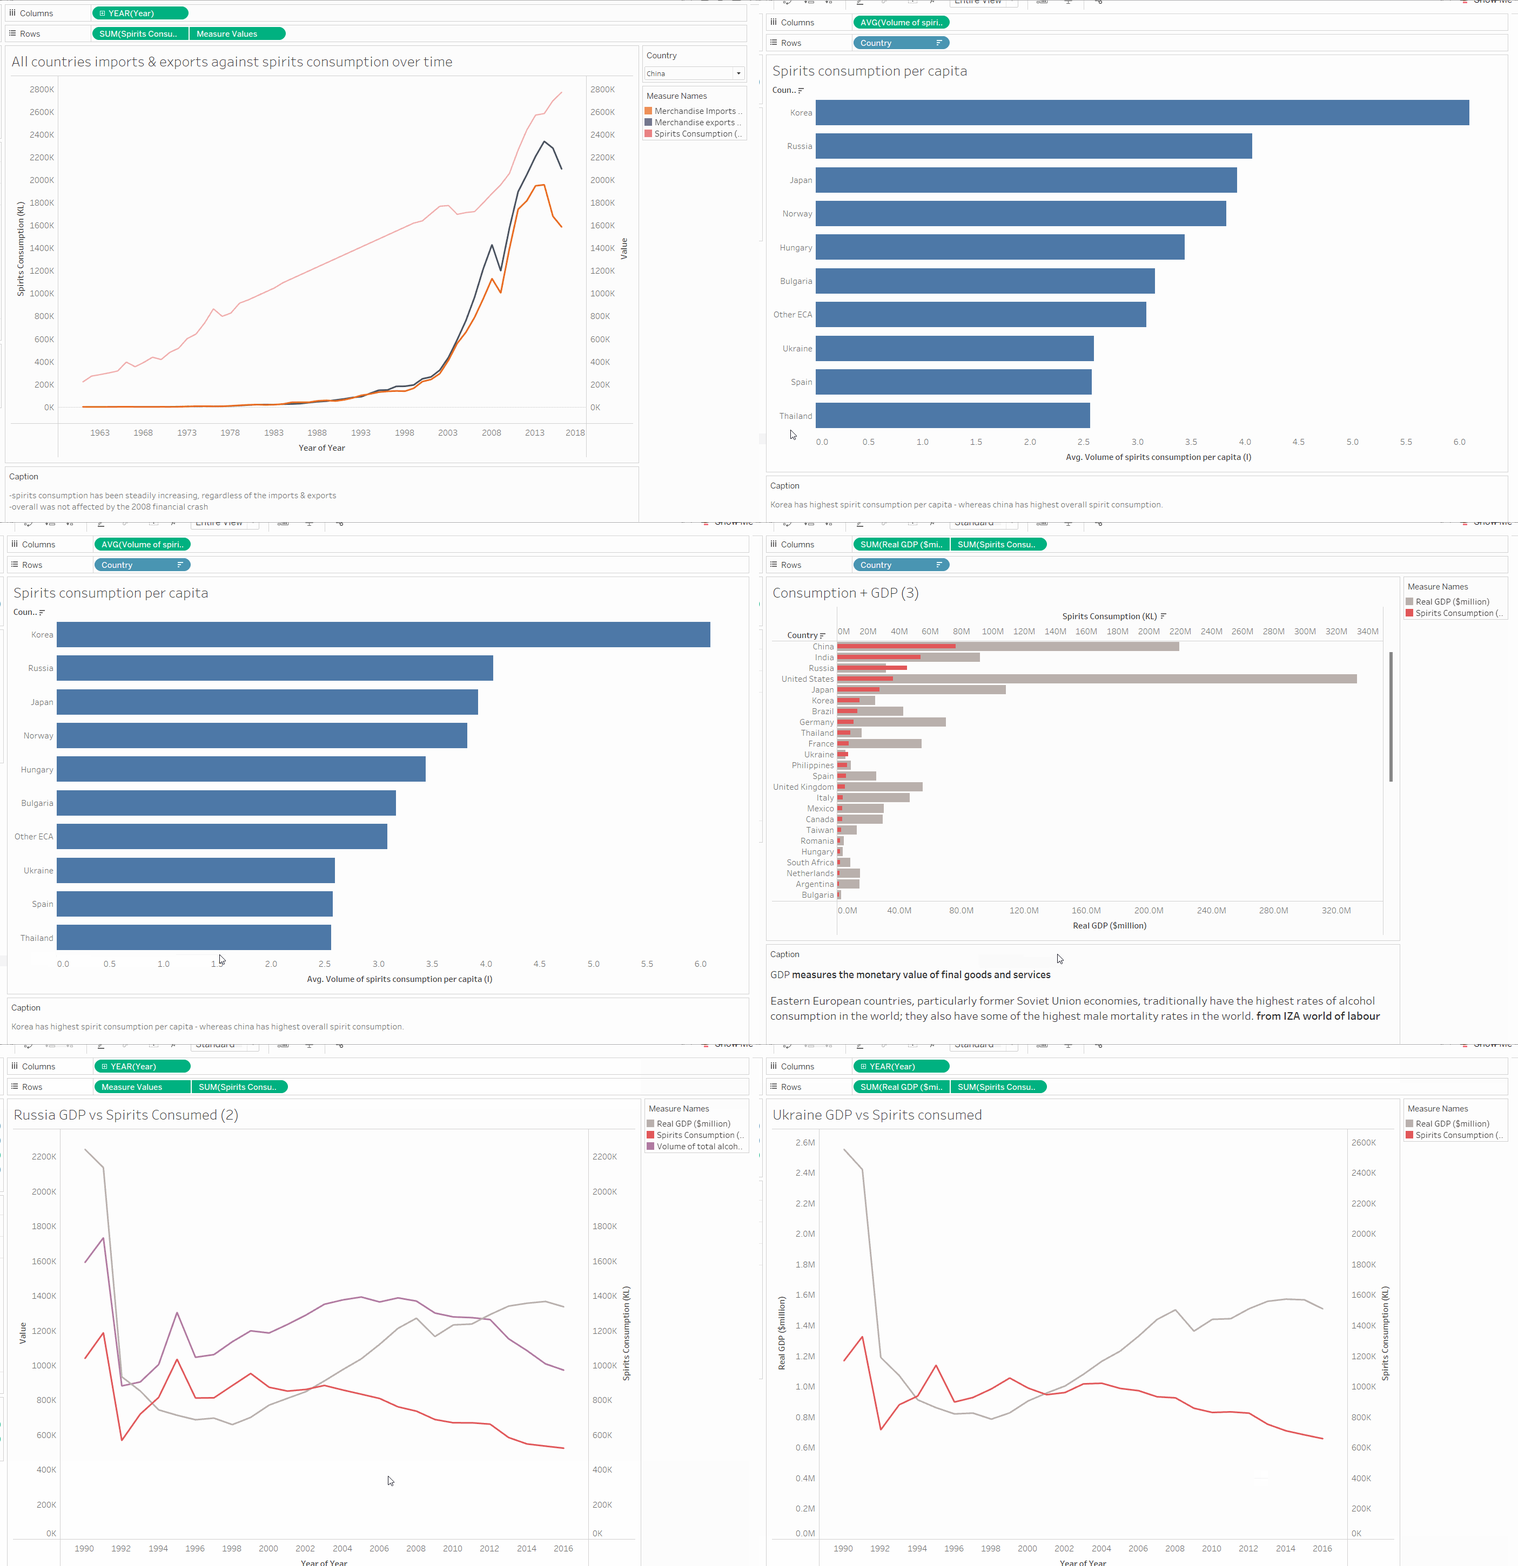
After prepping the data, I went into tableau to start my analysis and see what insights I could gain. However, where I wish I had spent more time on thinking up questions that I want to explore. This would have made my analysis a lot more focused. I went down a range of avenues but I could have still presented deeper analysis. As a dashboard was not a requirement, below is the finished views of analysis I presented.

