My last blog post focuses on some design principles to implement in your visualizations to make them more clear and concise. But an important step before you start visualizing your data is to prep it! Prepping your data, also known as Data Wrangling, is the process of transforming your data into a ready-to-use format. When prepping our data we should consider the following:
- Completeness: Are we missing any data? Does the data have what we need to answer our question(s)?
- Accurate: Is the data accurate? Is this the most current version of the data?
- Consistent: Are the records in the dataset recorded the same way?
- Incorrect Data Type: Are the columns using the data type(s) we want? Are date formats consistent throughout?
- Unique: Are there duplicate records within our data?
- Duplicated Records/Resources: If so, why do we have duplicate values? Are the duplicated records needed?
- Security Breach: Before sharing the data with others, are there any confidentiality regulations that should be followed?
Now that we understand what one should think about when preparing data, let’s introduce a tool that does exactly that – Tableau Prep Builder. Tableau Prep Builder comes with Tableau Desktop licenses, so if you or your company already uses Tableau to build their visualizations, they can also download Tableau Prep Builder!
Tableau Prep Builder is a handy little tool that makes prepping and cleaning data easier for analysis. In learning about this tool we were also introduced to Preppin' Data, a platform that posts weekly challenges to help the data community learn and practice how to use Tableau Prep Builder. With that being said, let’s do a starter challenge from Preppin’ Data to get used to this great tool that people who have Tableau Desktop often forget they have!
The challenge we'll be walking through is the 2021 Week 1 Challenge.
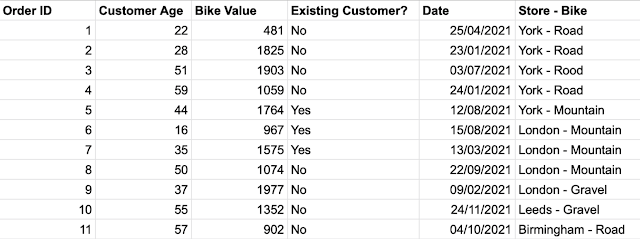
The dataset we’ll be putting into Tableau Prep looks like this:

Before starting our data prepping, we should take the time to examine our data and determine what our data holds, in other other words, what are the rows and columns about? From a quick glance, we can see that we are working with bicycle and customer-related data – it is a relatively small dataset with only 1,000 records.
Now, let’s get to business:
1: Connect and load the CSV file:
To connect and load the CSV file onto Tableau Prep Builder, we first click the plus sign to add a new connection, which in this case, is an Excel File.
2: Split the ‘Store-Bike’ field into ‘Store’ and ‘Bike’
Next, we will add a new step, a Clean step, to our workflow. We can then split the “Store-Bike” column by clicking on the three dots and selecting “Split Values”, and then choosing “Automatic Split”. Finally, we can rename the headers by double-clicking on the titles and typing “Store” and “Bike” respectively.
3: Clean up the 'Bike' field to leave just three values in the 'Bike' field (Mountain, Gravel, Road)
There are a few ways to fix the values under the “Bike” column, but the way used here is by grouping. If we click on the three dots, we can “Group Values”. For this step, we will group values by “Manual Selection” – this allows us to group all the values at the same time. If we select the correct spelling of Gravel (or Mountain or Road), we can then select the incorrect spellings to be grouped with the correct spelling, thus cleaning up the column!
4: Create two different cuts of the date field: 'quarter' and 'day of month'
Here can begin by duplicating our date field – click on the three dots and select “Duplicate Field”. With our two date fields, we can select the three dots again and select “Convert Dates”, this allows us to change the date format in whatever way we would like. For the first date field, we will convert it to “Quarter Number” and the second date field will be converted to “Day of the Month”. Lastly, we rename the date fields.
5: Remove the first 10 orders as they are test values
To remove the first 10 orders we can click on the dots under Order ID and “Filter” for “Selected Values”. Since we want to remove the first 10 orders, we select numbers 1 through 10 and “Exclude” those records.
5.5: Extra Step – Remove Unnecessary Columns and Reorganize
Before outputting our data, we can rearrange our columns in the profile pane by dragging them into the order we would like. We can also remove unnecessary columns by clicking on the three dots and selecting “Remove”. We want our final product to look like this:
6: Output the data as a CSV
We can now add a final step, an Output step, to our workflow. In this workflow step, we can select where we want our output file to be saved, how we want it named, and what file type we would like. After modifying all these steps we can perform the most important step in saving our output … “Run Flow”!
Congratulations! You just walked through your first Preppin’ Data challenge AND you learned some important skills to implement in your data prepping!
