


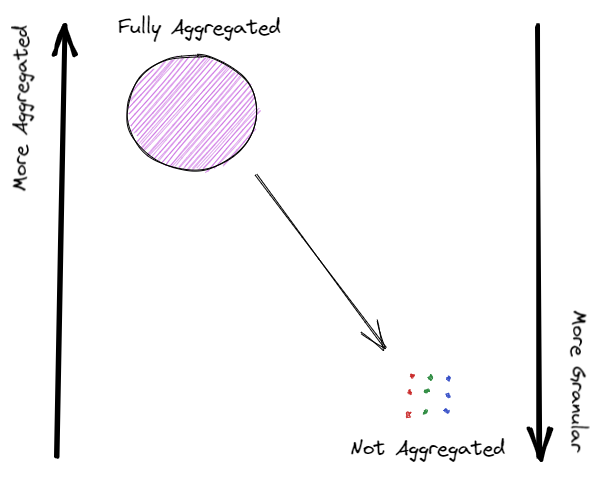
Level of Detail calculations, also known as LODs, allow users to compute values at both the data source level and at the visualization level in Tableau. They allow users to perform complex calculations on data based on different levels of granularity. In other words, LODs let you specify the level of detail that you want your data analyzed, rather than being limited to what’s currently in the view. Simply put, it means the depth at which you want to see your data.
There are 3 types of LODs:
FIXED (Entirely independent level) – Allows you to perform calculations independently of what is currently in your view.
INCLUDE (More granular level) – Allows you to add dimensions to your view even if those dimensions are not currently in your view.
EXCLUDE (Less granular level) – Allows you to perform calculations by subtracting dimensions from your view.
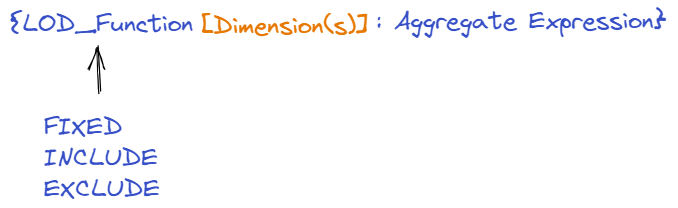
The General Syntax for LODs are:
It’s important to note when LODs are executed in Tableau’s order of operations. The order of operations in Tableau, also known as the query pipeline, is the order in which Tableau performs its operations/actions. When you create a view and add filters, those filters will abide by the following order (in order to retrieve the corresponding data):

FIXED
A FIXED LOD allows you to compute values using specific dimensions, without referencing dimensions that are currently in your view. Thus, regardless of the dimensions that are currently in the view, a FIXED LOD will always compute a calculation at the level of granularity you set.
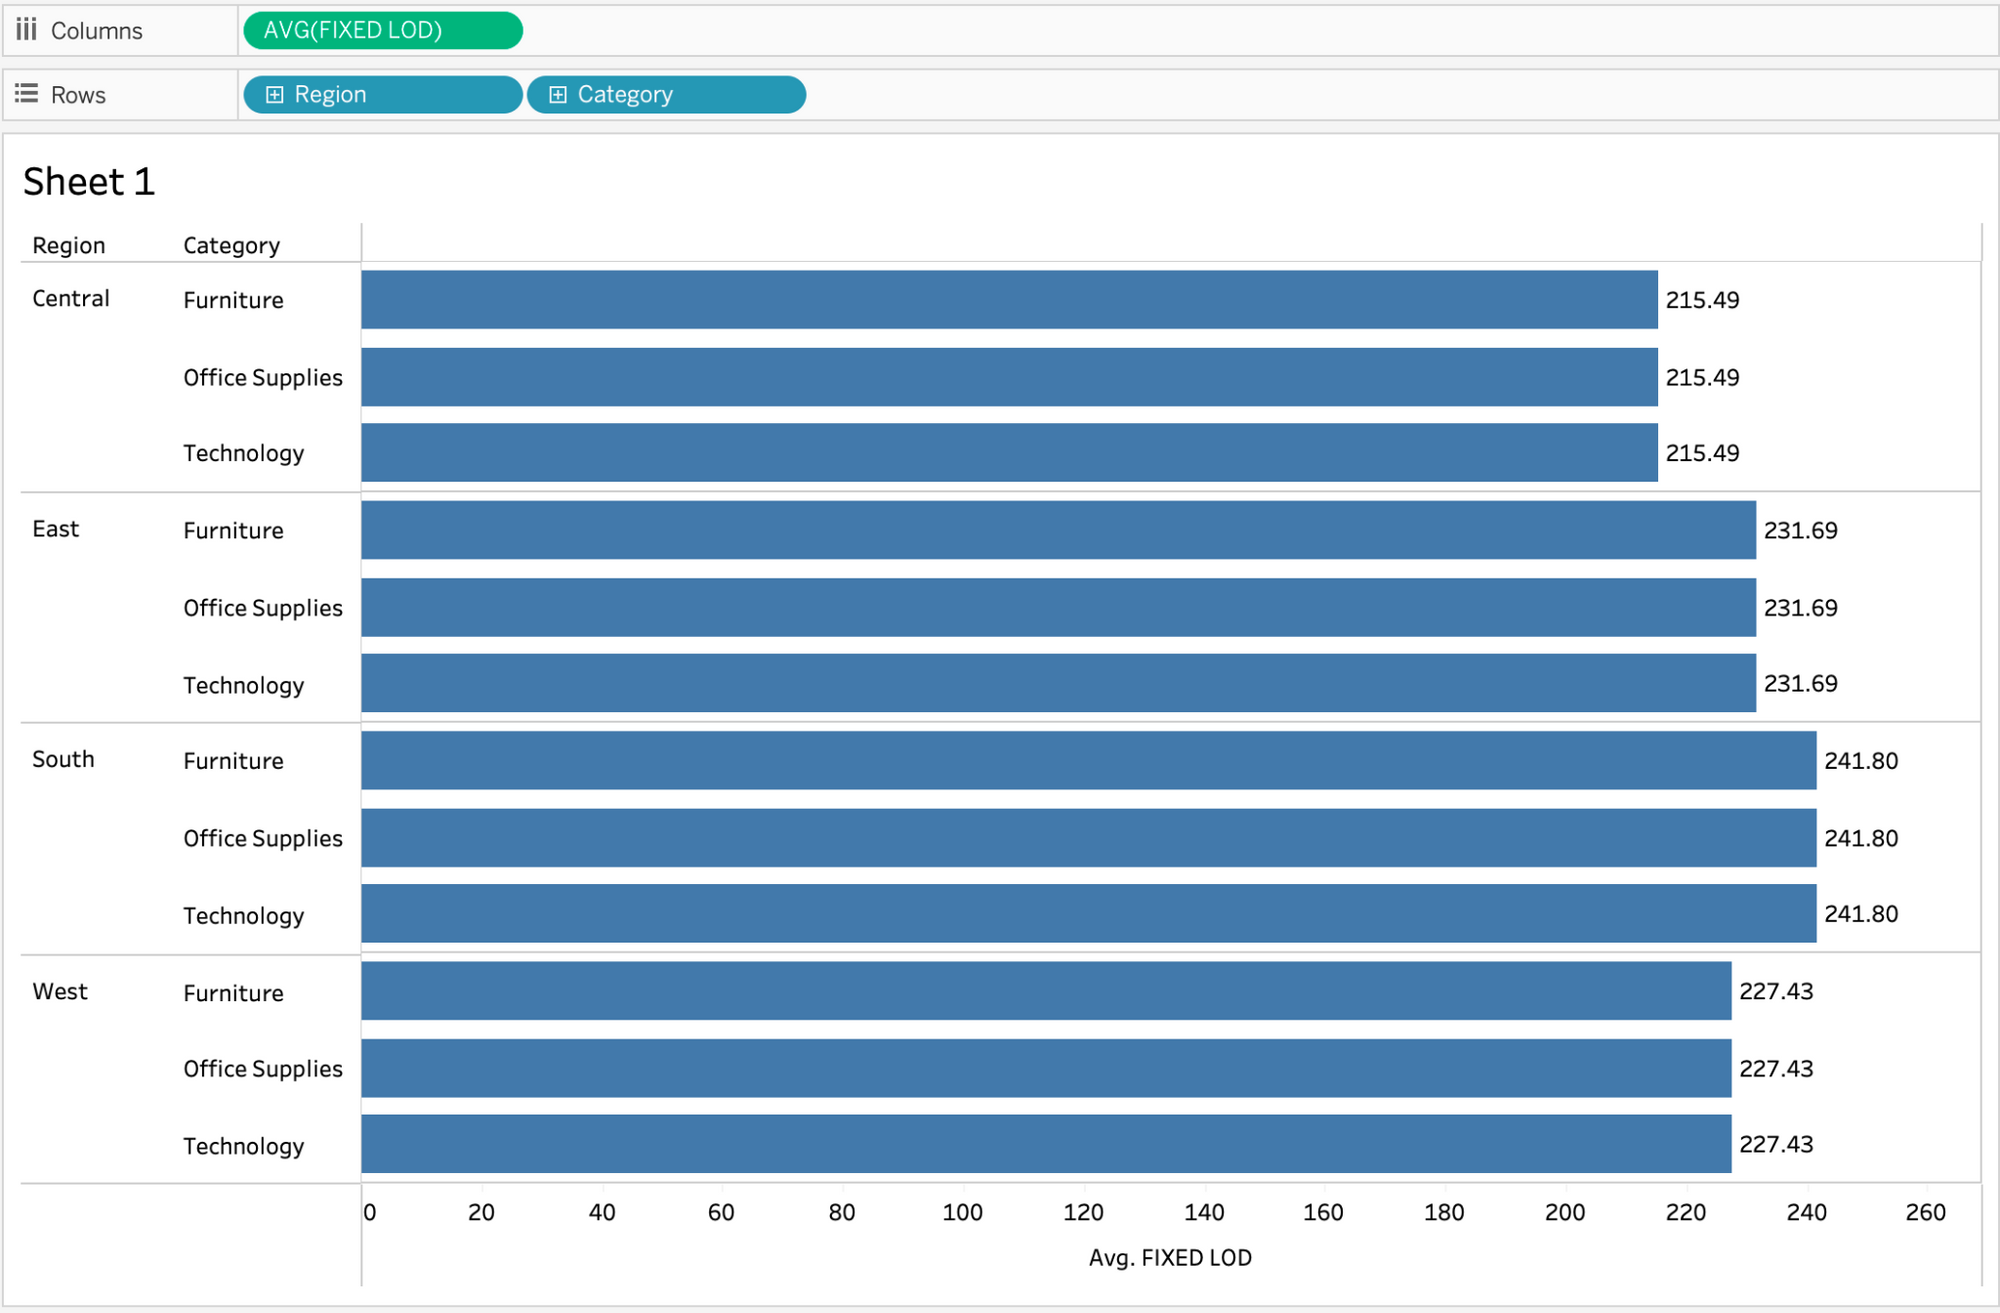
For example, let’s calculate the average sales per region:
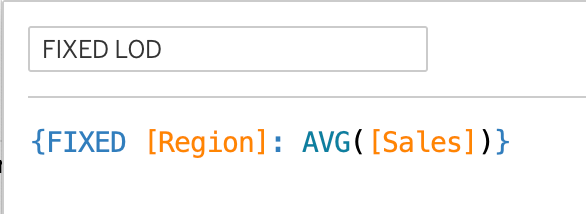
This expression is telling Tableau to fix the level of detail at the regional level and then calculate the average sales for each region. What we're doing is fixing the data to ignore any filters that are built-in and focus in on region. This is saying “For each region, calculate the average sales”.
Before the LOD we we’re getting the view broken up by region and category, giving us the average sales for each category and region grouping or combination:
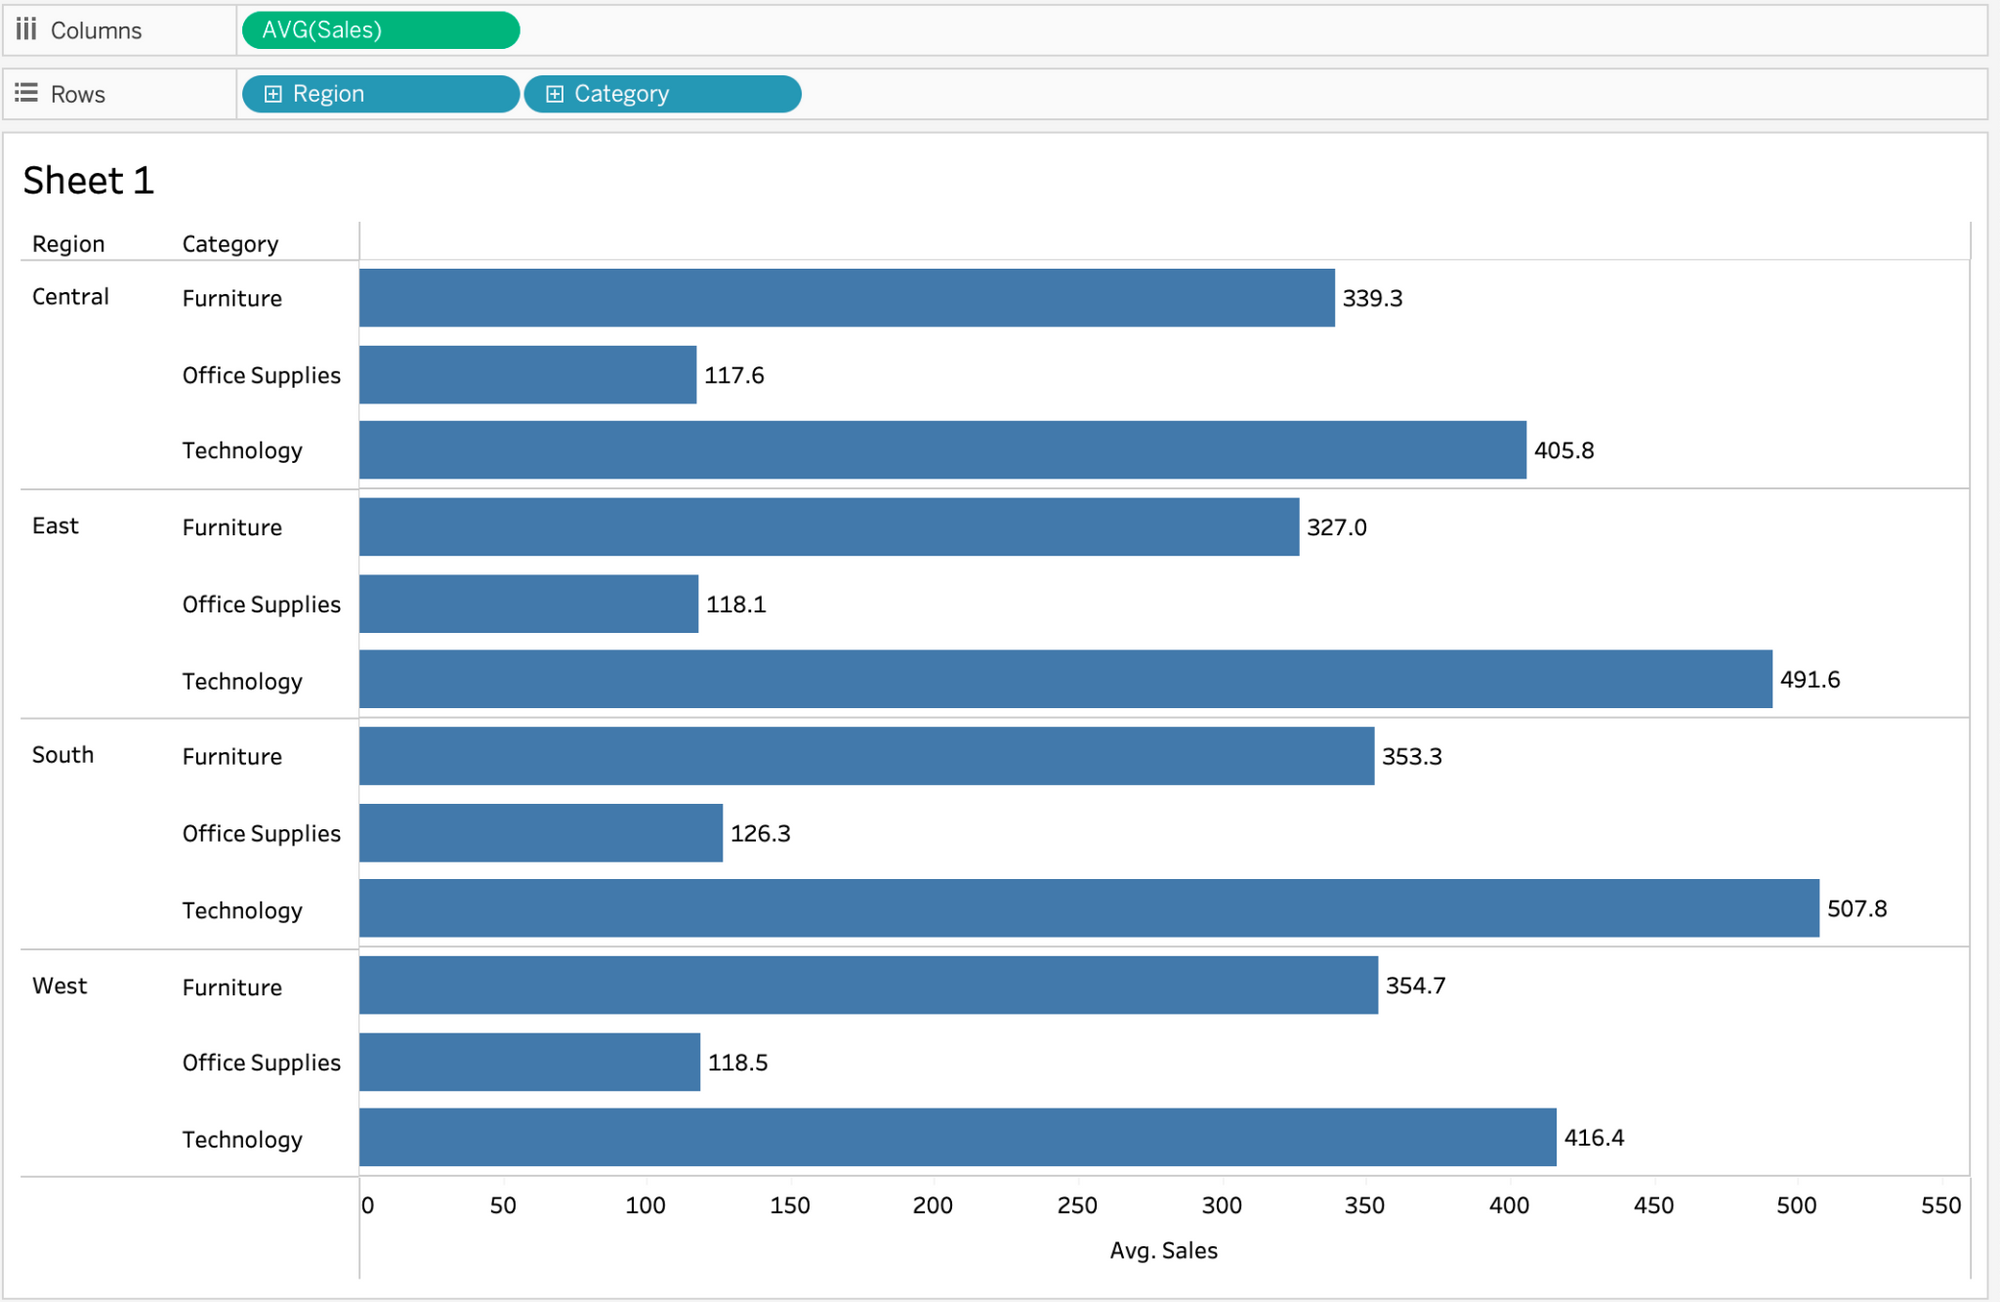
Using the LOD we are now getting the average sales only by region and ignoring the category dimension in this calculation:
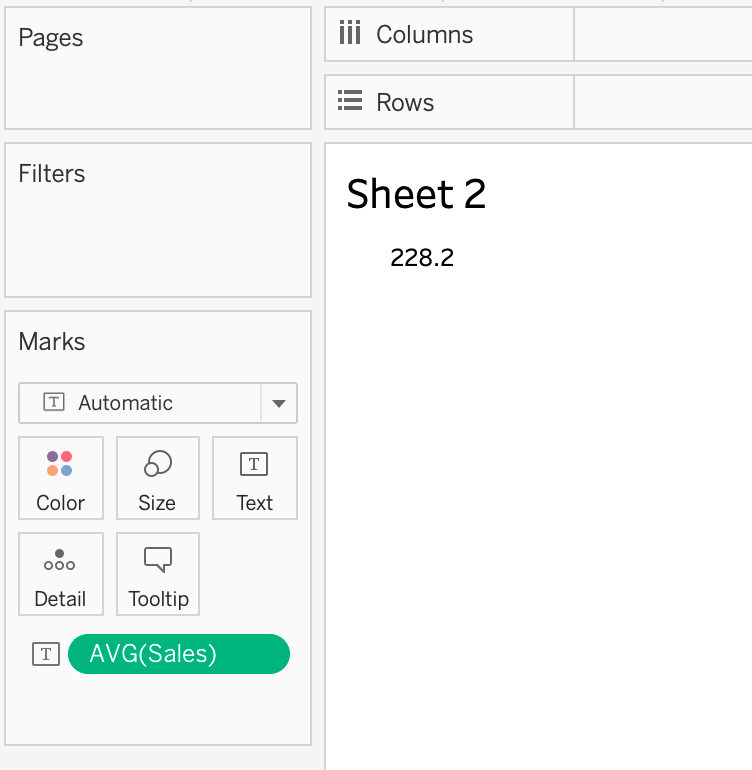
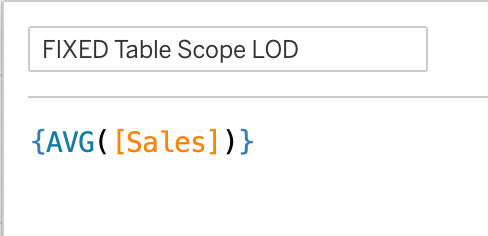
We can also use a FIXED LOD without referencing any dimension and create a table scoped FIXED LOD.
If we put AVG([Sales]) into the view with no dimension we get the following view (because we are not segmenting the view in any way):
If we were to add a dimension to segment this view, we would get something like this where were getting the average sales for each category:
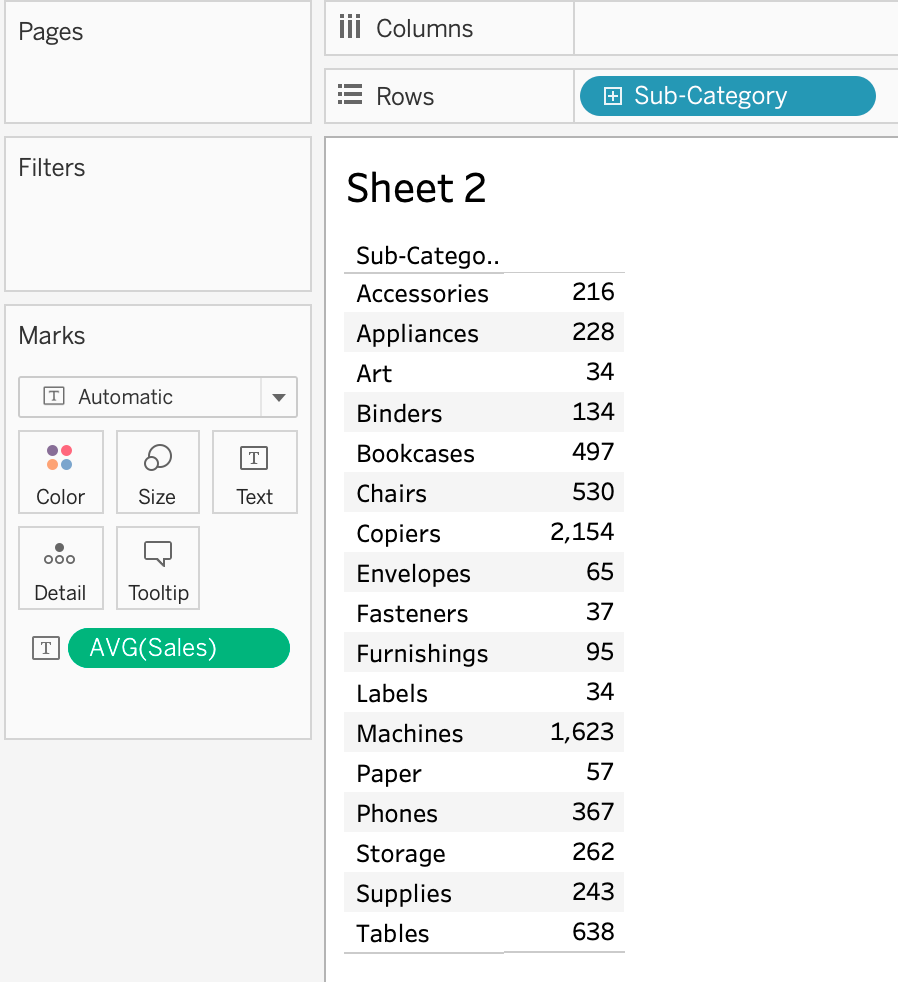
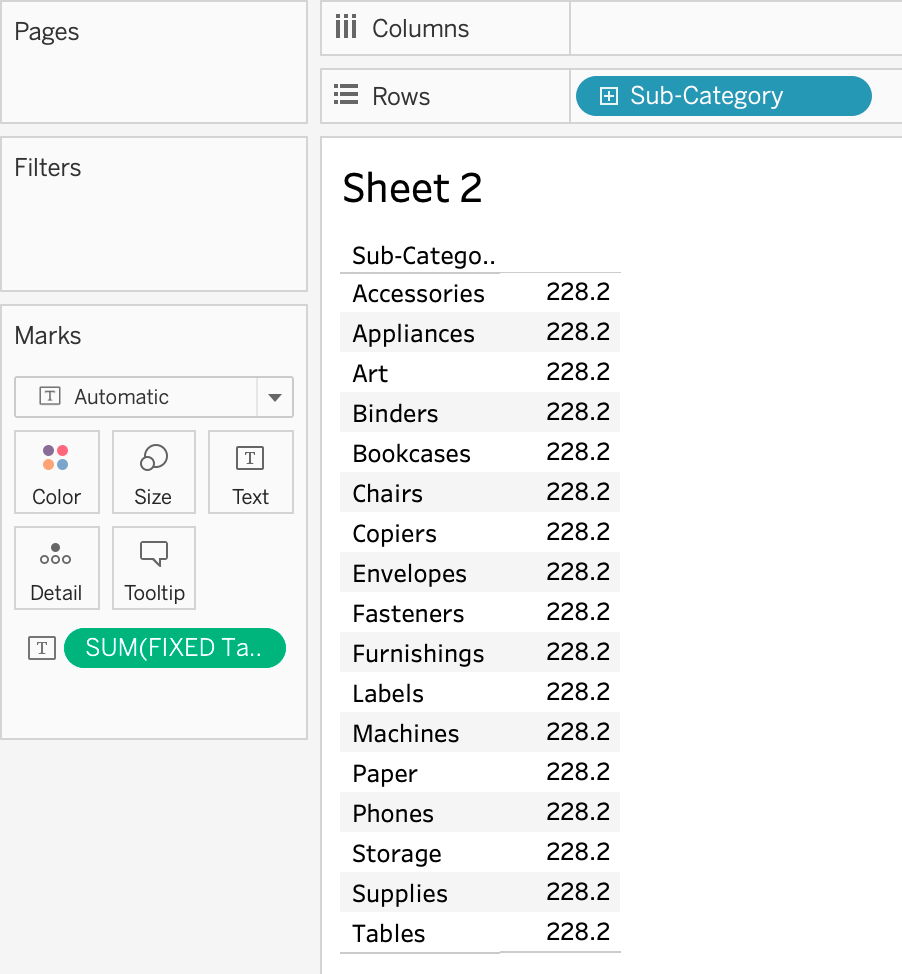
But if we create a table scoped FIXED LOD where we do not add any dimension in our syntax, we can get the average sales of the whole table regardless of the dimension(s) being added to the view:
INCLUDE
An INCLUDE LOD allows us to compute values using specified dimensions from the LOD and the dimensions that are in your view. A few things to note when using an INCLUDE LOD:
- This LOD is affected by the dimension filter (review the Tableau order of operations).
- Fields based on INCLUDE LOD expressions will change as you add or remove dimensions from the view.
- INCLUDE LODs are helpful when we want to compare different aggregations to the original measure.
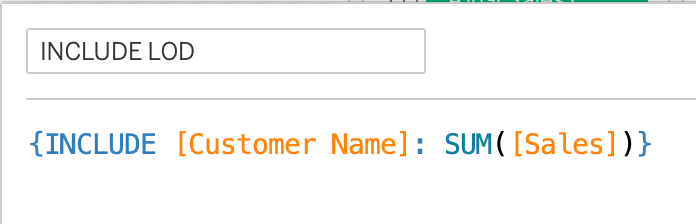
This INCLUDE LOD is calculating the total sales per customer:
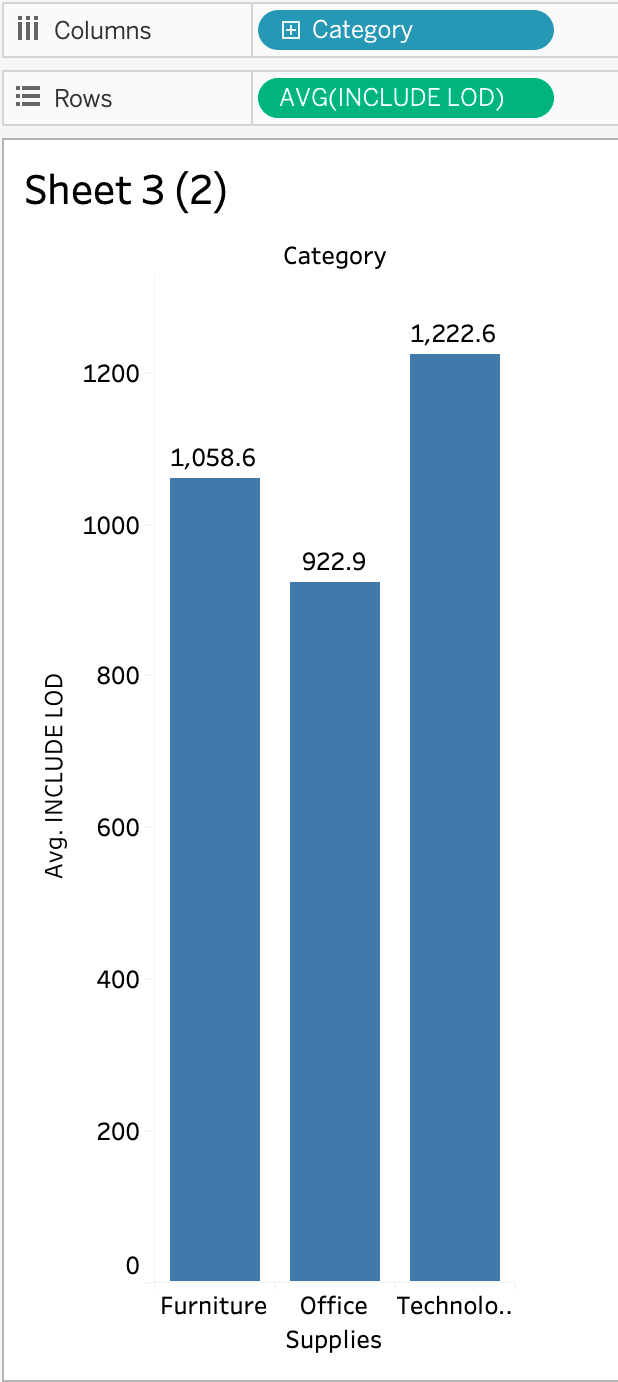
Now, let’s create a view using our INCLUDE LOD on a shelf and have it aggregated as average. We can then place category on the other shelf. What we are now seeing is the average customer sales amount per category.
To better understand what is going on, let’s add sales to our shelf with our LOD and have it aggregated to average. Without the LOD, we are not including the customer level in our average, so we are just seeing the average sale amount for a category. But, when incorporating an INCLUDE LOD using customer name, we are now seeing the average sales amount per customer per category:
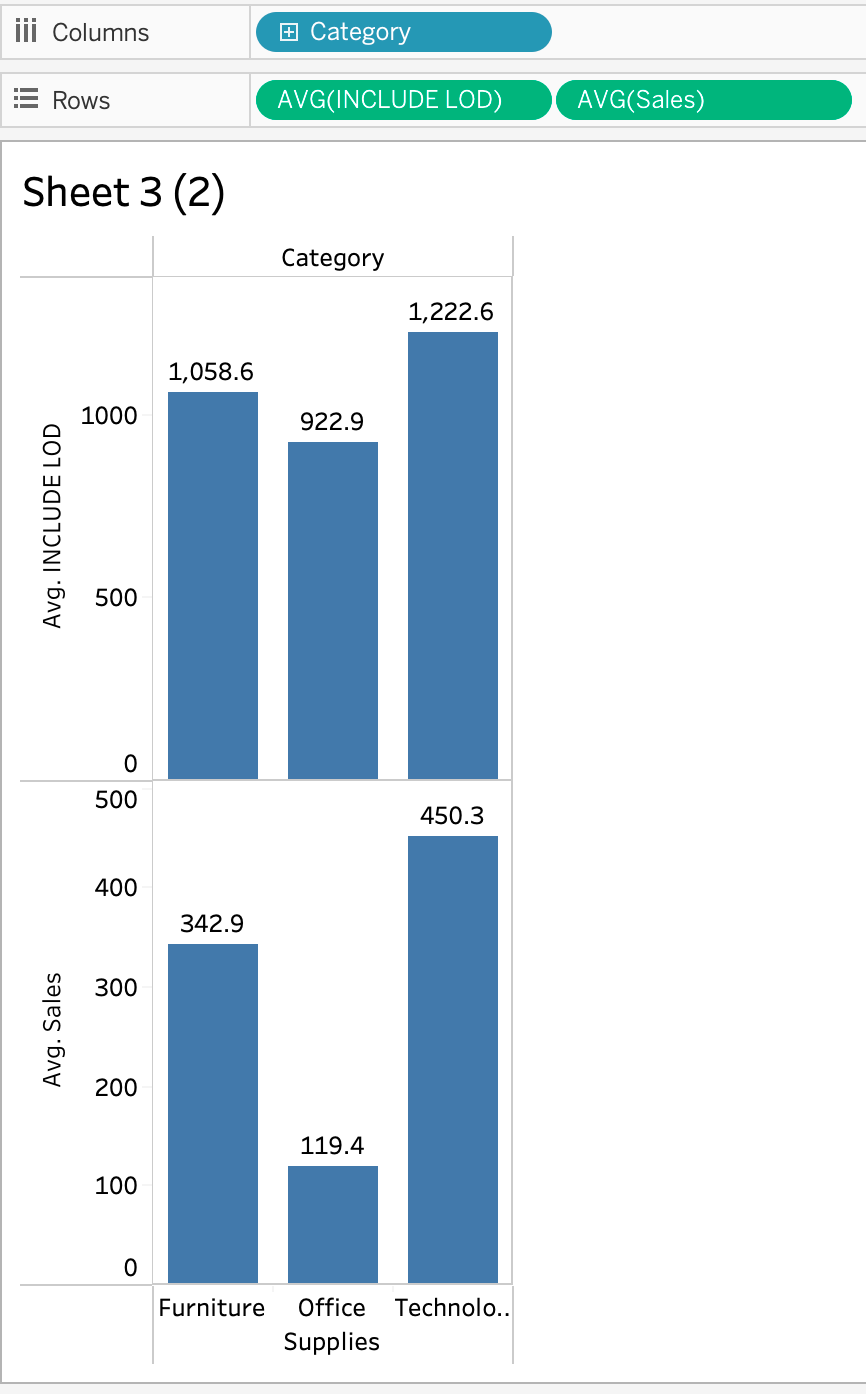
The AVG([Sales]) is calculating the average of the sale values across all the data points in the view. This does not account or consider any specific level of detail or grouping of the data. But for the INCLUDE LOD, we are calculating the average sum of sales values for each customer and category combination. Since we are using an INCLUDE LOD, we are not only accounting for the dimensions in the LOD, but also the dimensions in the view.
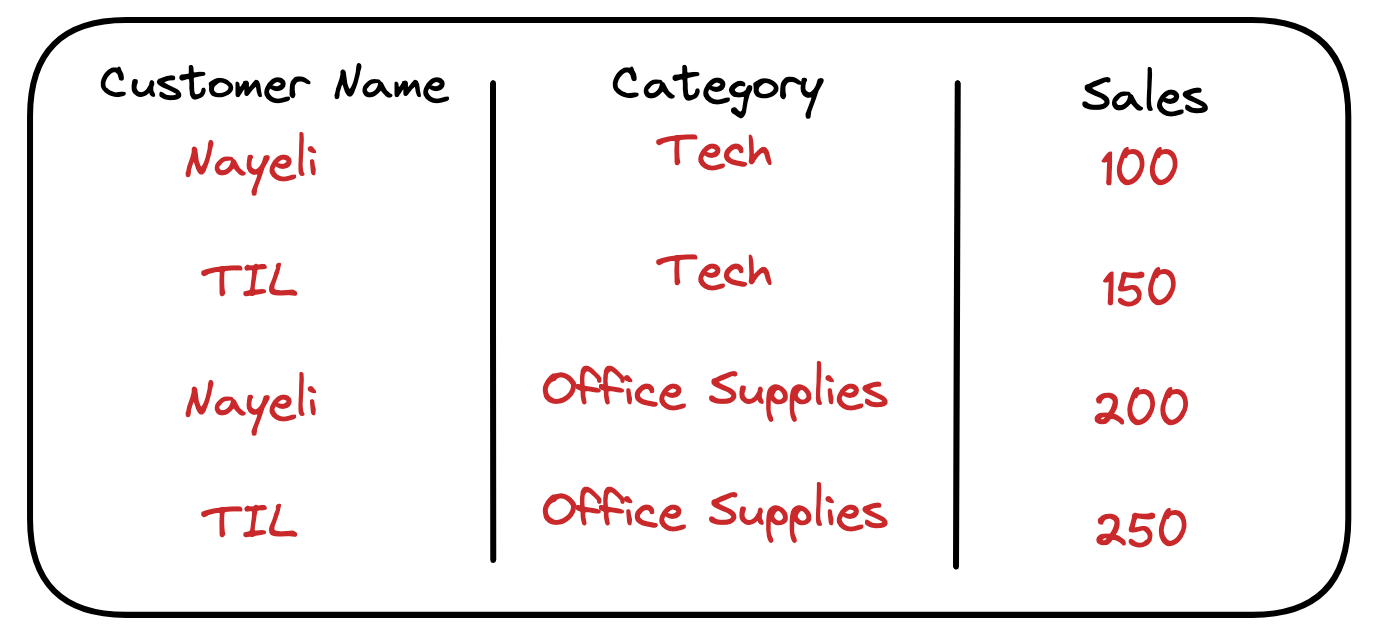
Let’s say we have a dataset that looks like this:
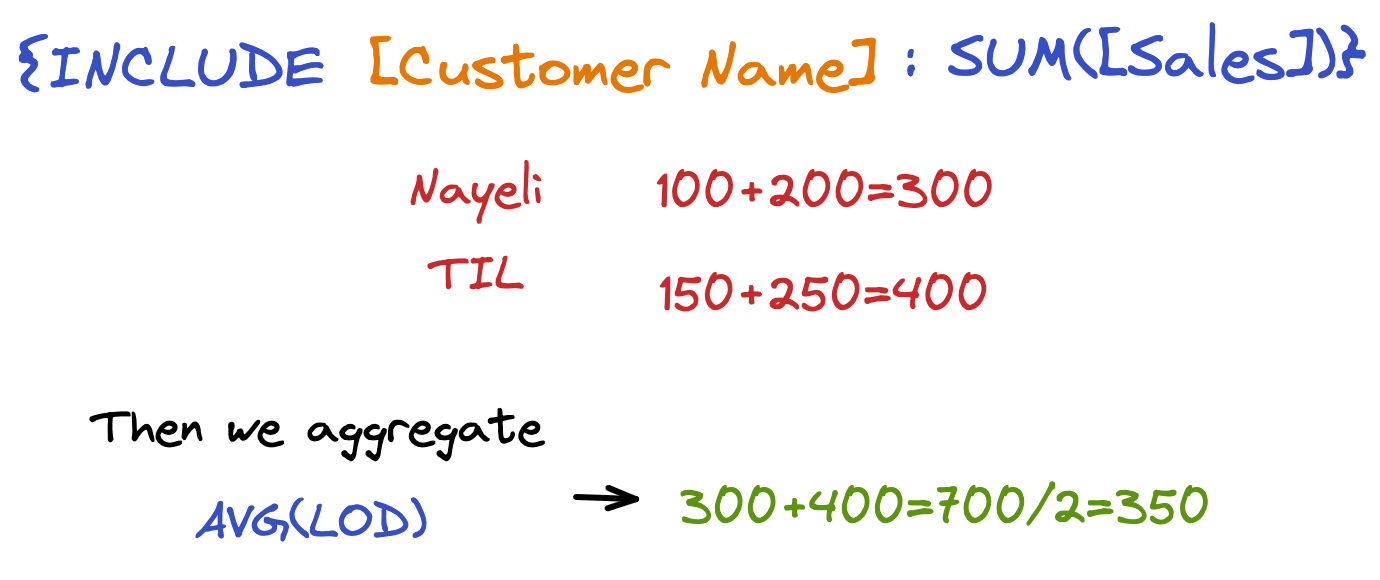
Our INCLUDE LOD (with the aggregation of average) would look like this:
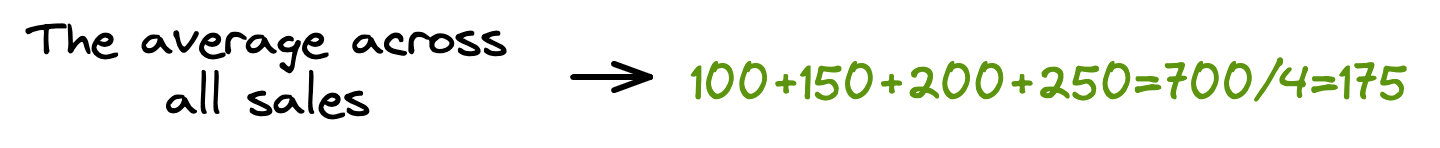
But if we do just the average of sales across all data points we get:
EXCLUDE
An EXCLUDE LOD allows us to specify the level of detail we want when computing values by excluding dimensions. This LOD is also affected by the dimension filter (review the Tableau order of operations).
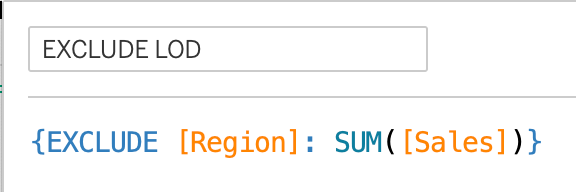
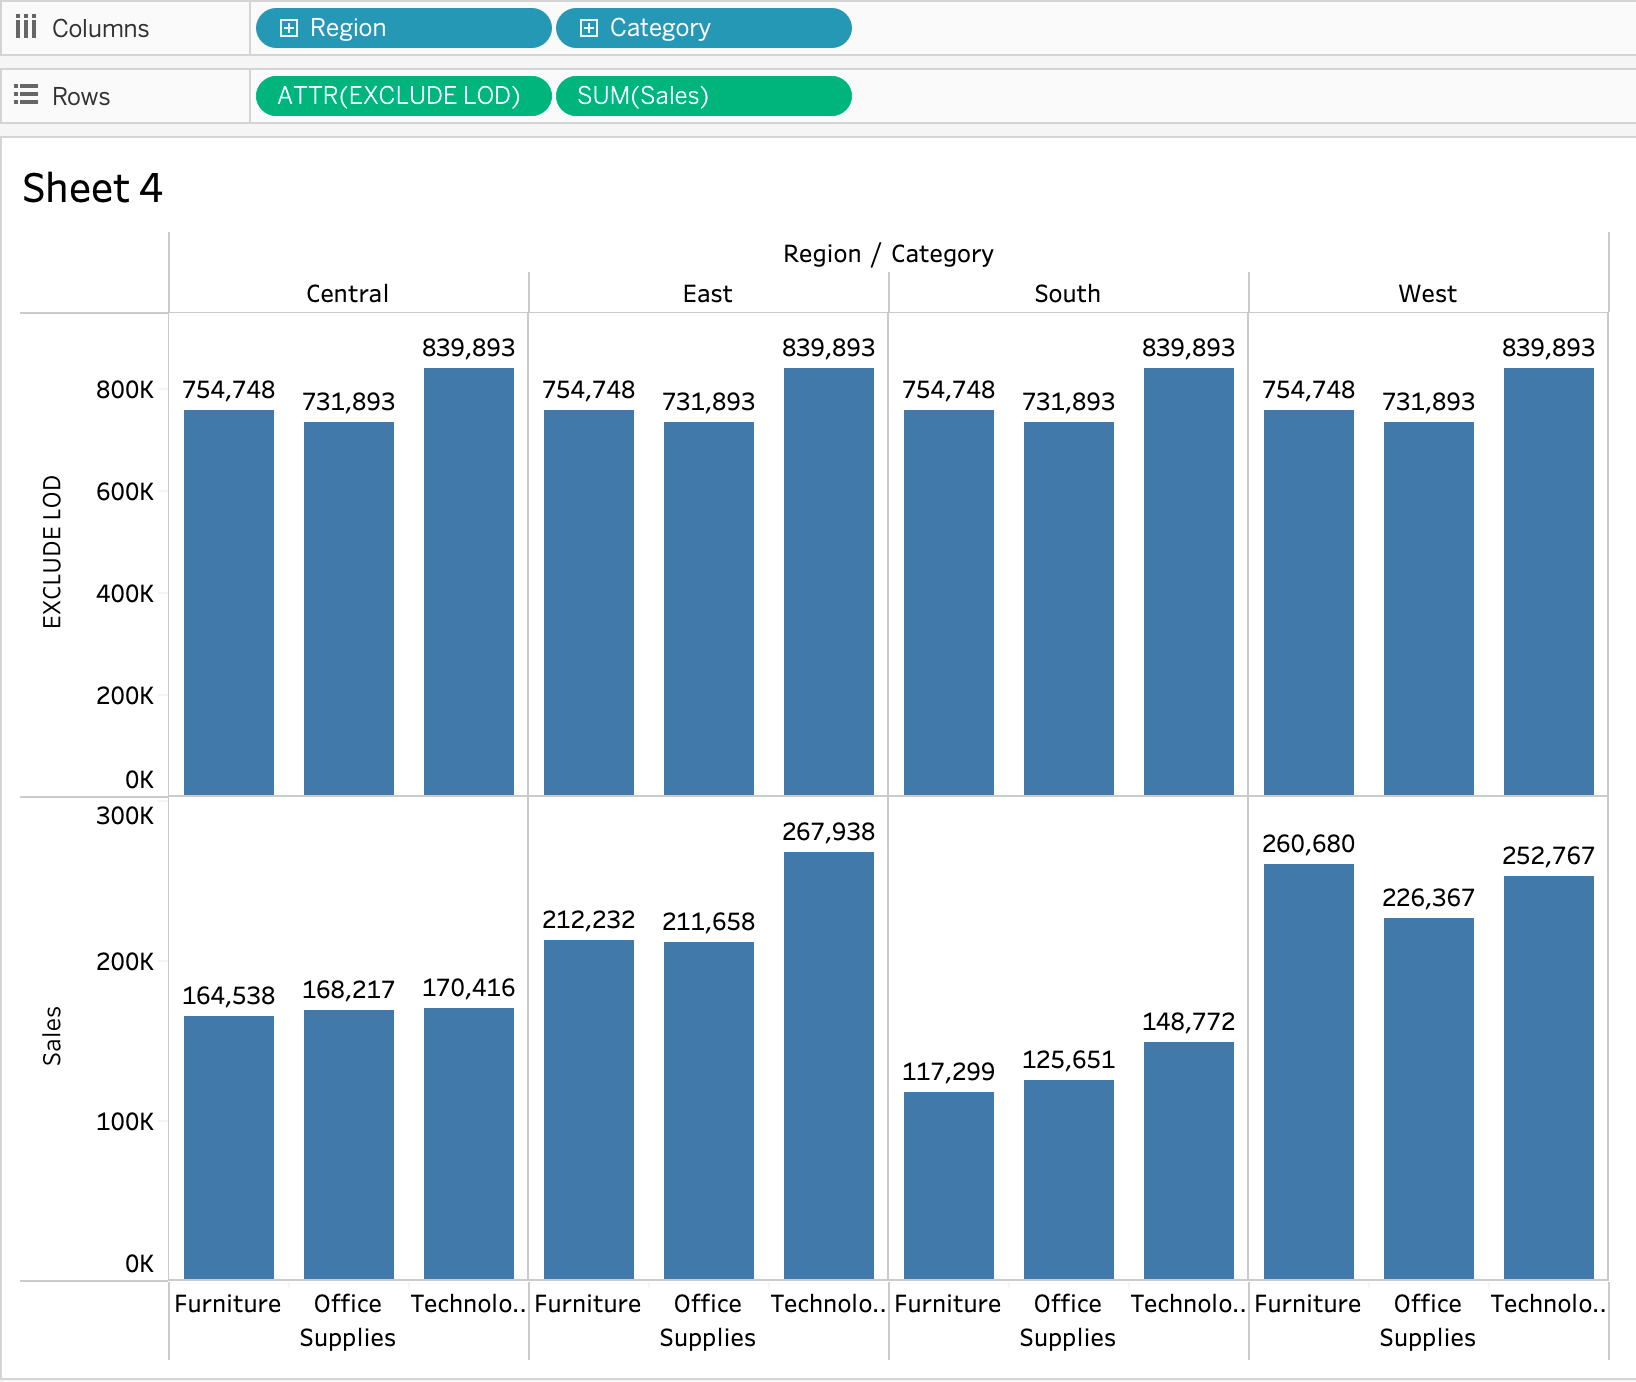
Suppose we want to create a view using region and other dimensions, but we do not want region included in our sales calculation(s), we can create the following EXCLUDE LOD:
This expression will exclude the region dimension and give us the sales for all other dimensions that we place into our view. If we create a view with both region and category on a shelf, and the EXCLUDE LOD and the sum of sales on the other shelf, we can see that even though region is apart of our view, the EXCLUDE is only calculating the sum of sales segmented by category, where as our regular sum of sales is getting the total sales of each category and region combination:
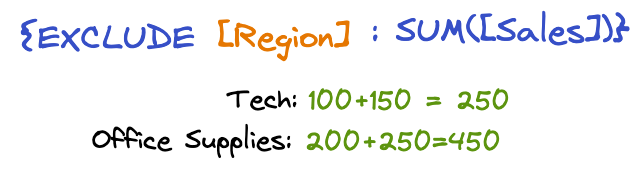
Let’s say we have a dataset like this:
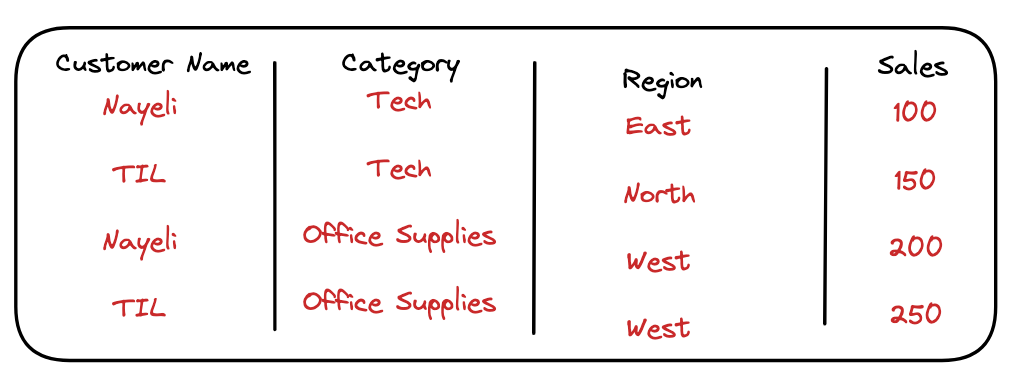
The EXCLUDE LOD is calculating the total sales by category, without region, even though region is in the view:
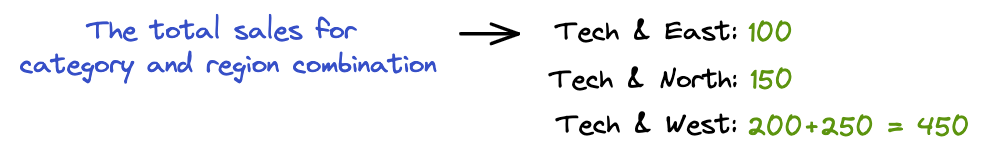
Whereas doing total sales with what’s in the view is creating the summation using a region and category combination:
To summarize, why are these views and calculations helpful?
We can use LODs to create custom aggregations that would not have been available if we we're being limited to what’s in our view. Using LODs allow us to create aggregations that are higher or lower level of granularity than our visualization’s level of detail.Using LODs, we can compare different levels of detail in a single view. And finally, since LODs lie in different areas of our Tableau order of operations, we can use them to create specific filters and use the order of computations to our advantage!