We all love maps, they allow us to display geographical data in a way that’s easy to read while also providing the geographical context that’s needed to understand different types of datasets. We can implement symbols, colors, labels, legends, and scales to our maps to help aid our analysis and understanding of our data. While Tableau has a lot of features that simplify the process of creating map based visualizations, there is a limited selection for how they can look. We can see what background options we have by going to the Format tab and selecting “Background Layers…”.
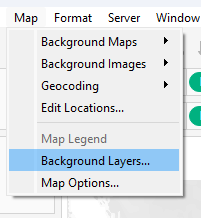
In this pane, we can find the various styling, background map layering, and data layering options available to overlay on a map view. And while these options can make many different looking maps, there will come a time when you want to bring in your own background image for your map (instead of using the options presented by Tableau).

Importing A Background Image For Your Map
(method inspired by https://www.udemy.com/user/lukashalim/)
For this walkthrough I’ll be using this dataset on rat sightings in New York City: https://www.kaggle.com/datasets/new-york-city/nyc-rat-sightings
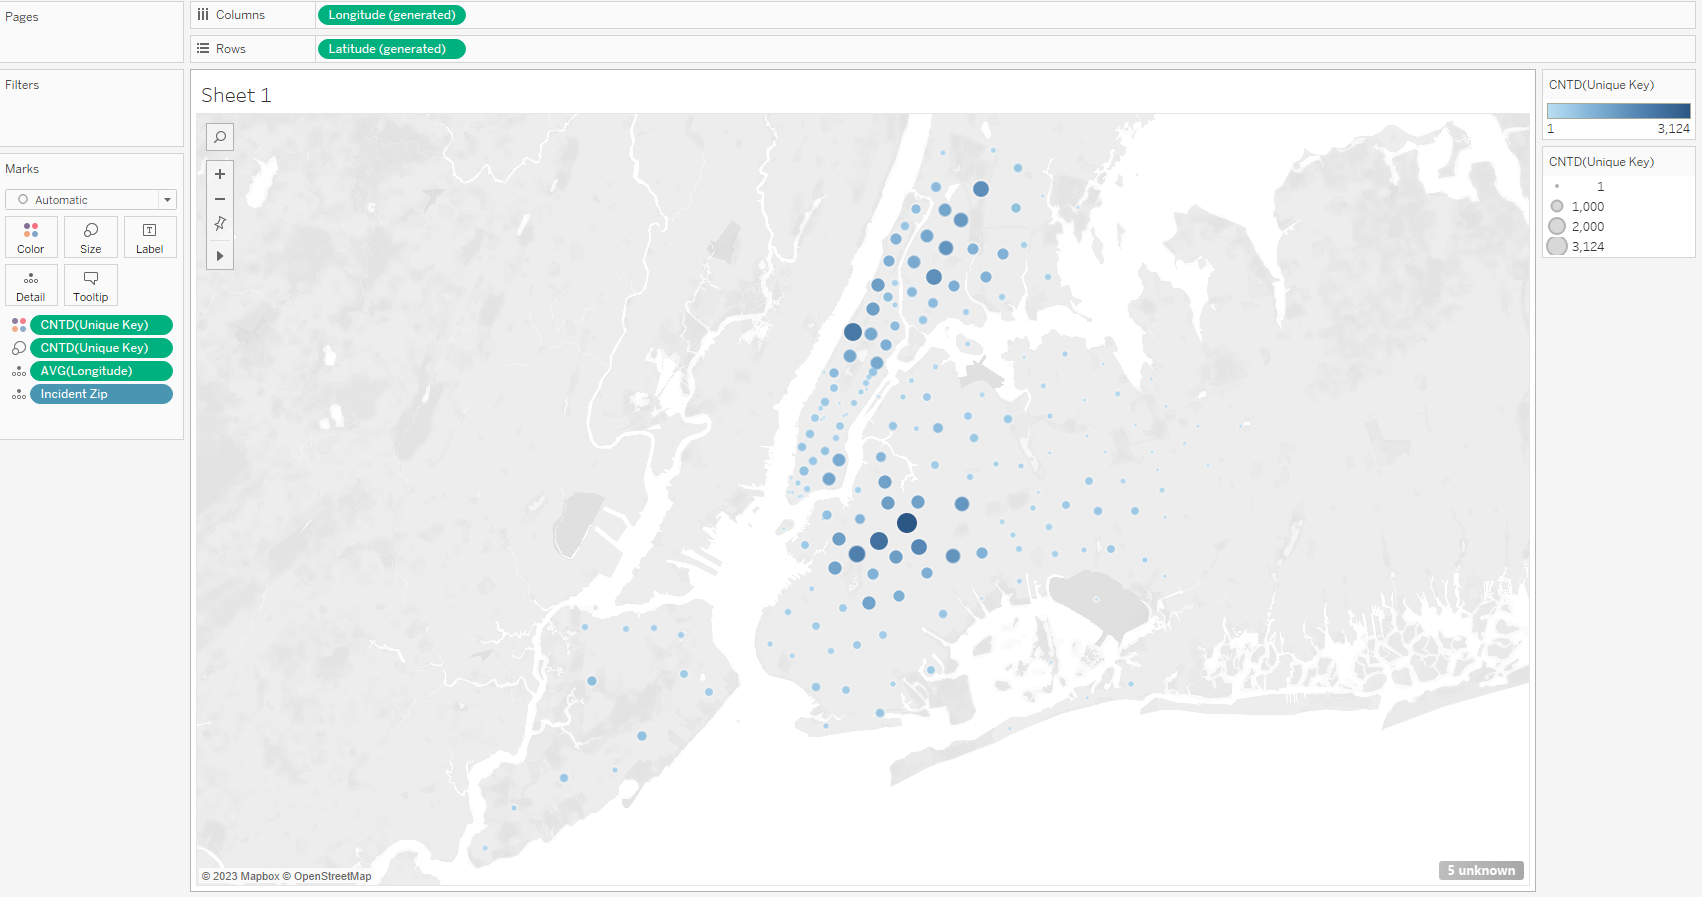
After downloading the data and connecting to Tableau let’s create a symbol map showing the number of incidents (which is the distinct count of the “Unique Key” field) by NYC ZIP Codes.
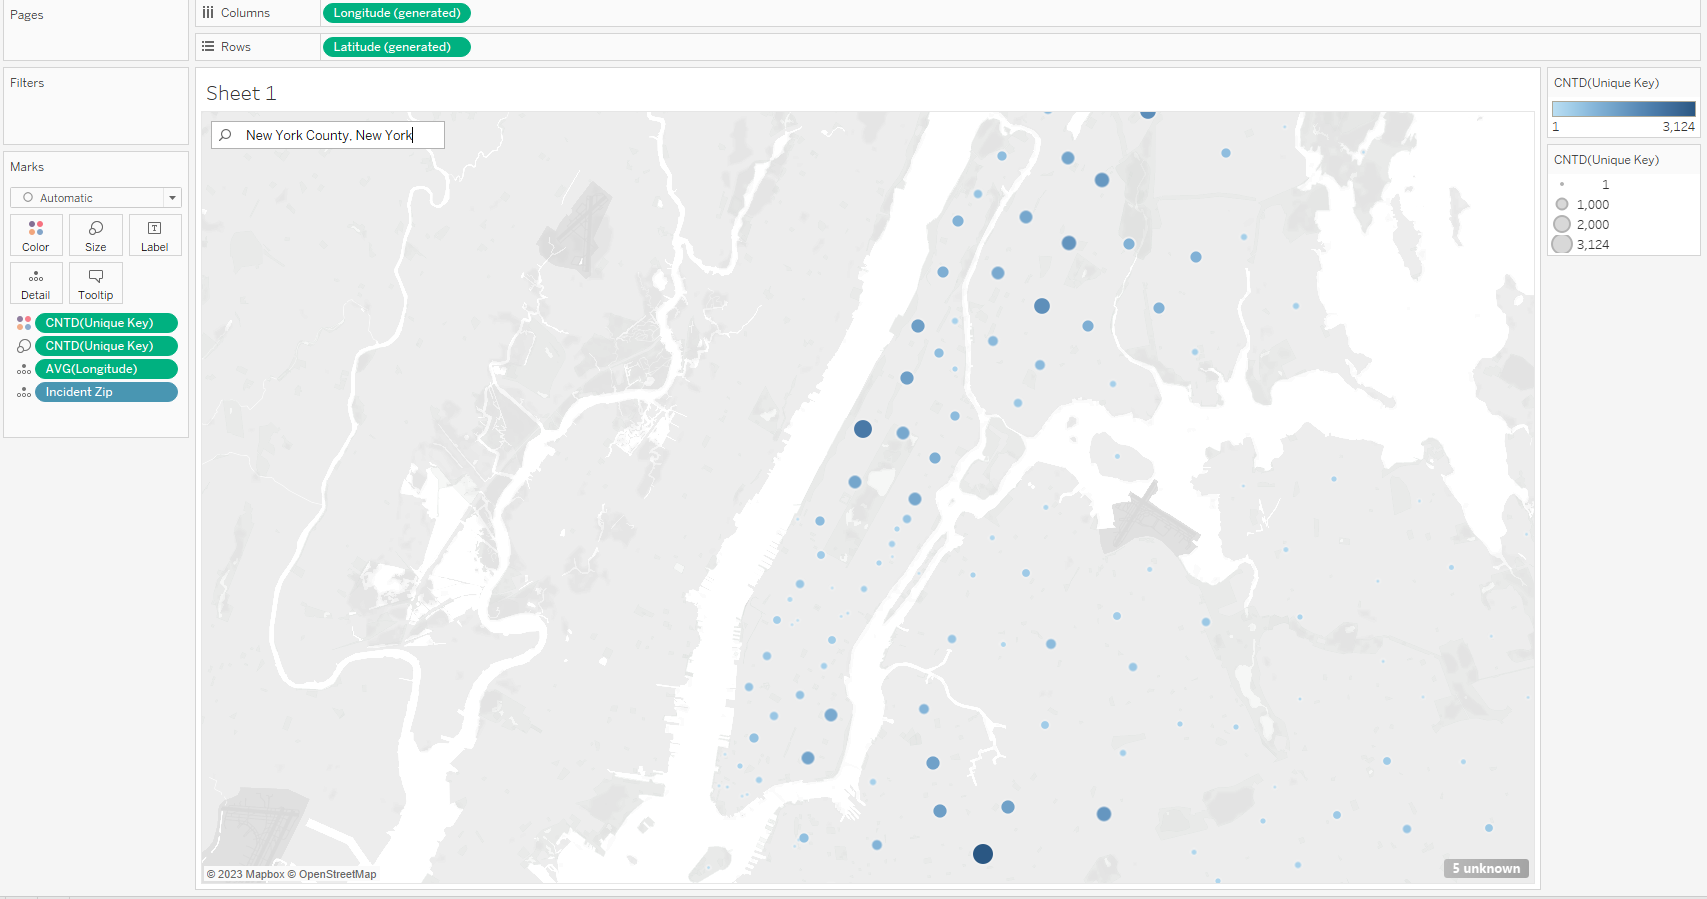
However, for this example, we want to focus specifically on Manhattan. Thus, we can use the magnifying glass icon to open a search bar. In this search bar we can type in a city, state, or geographical feature we would like our map to center on.
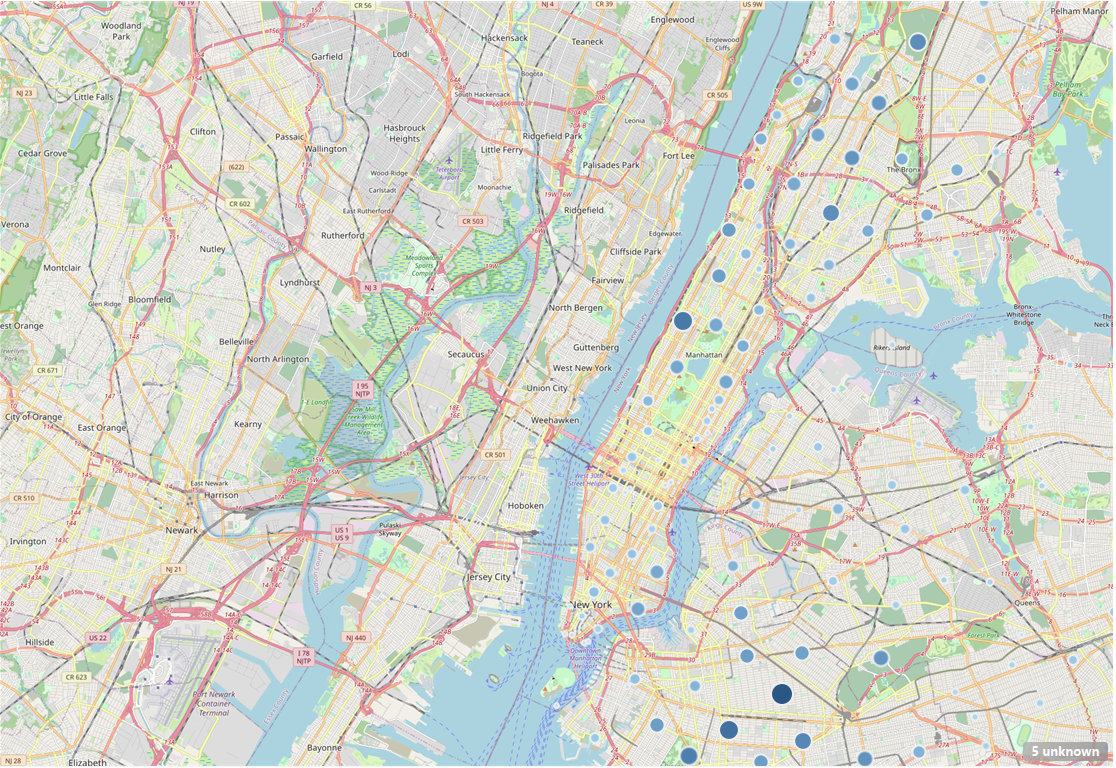
With our visualization now set up, we can use https://www.openstreetmap.org/#map=5/38.007/-95.844 to download an image of a map of Manhattan that we would like to use to replace what we currently have.
On the site, we can search for the location we want. In this case, we want to search for Manhattan, resulting the in the following view:
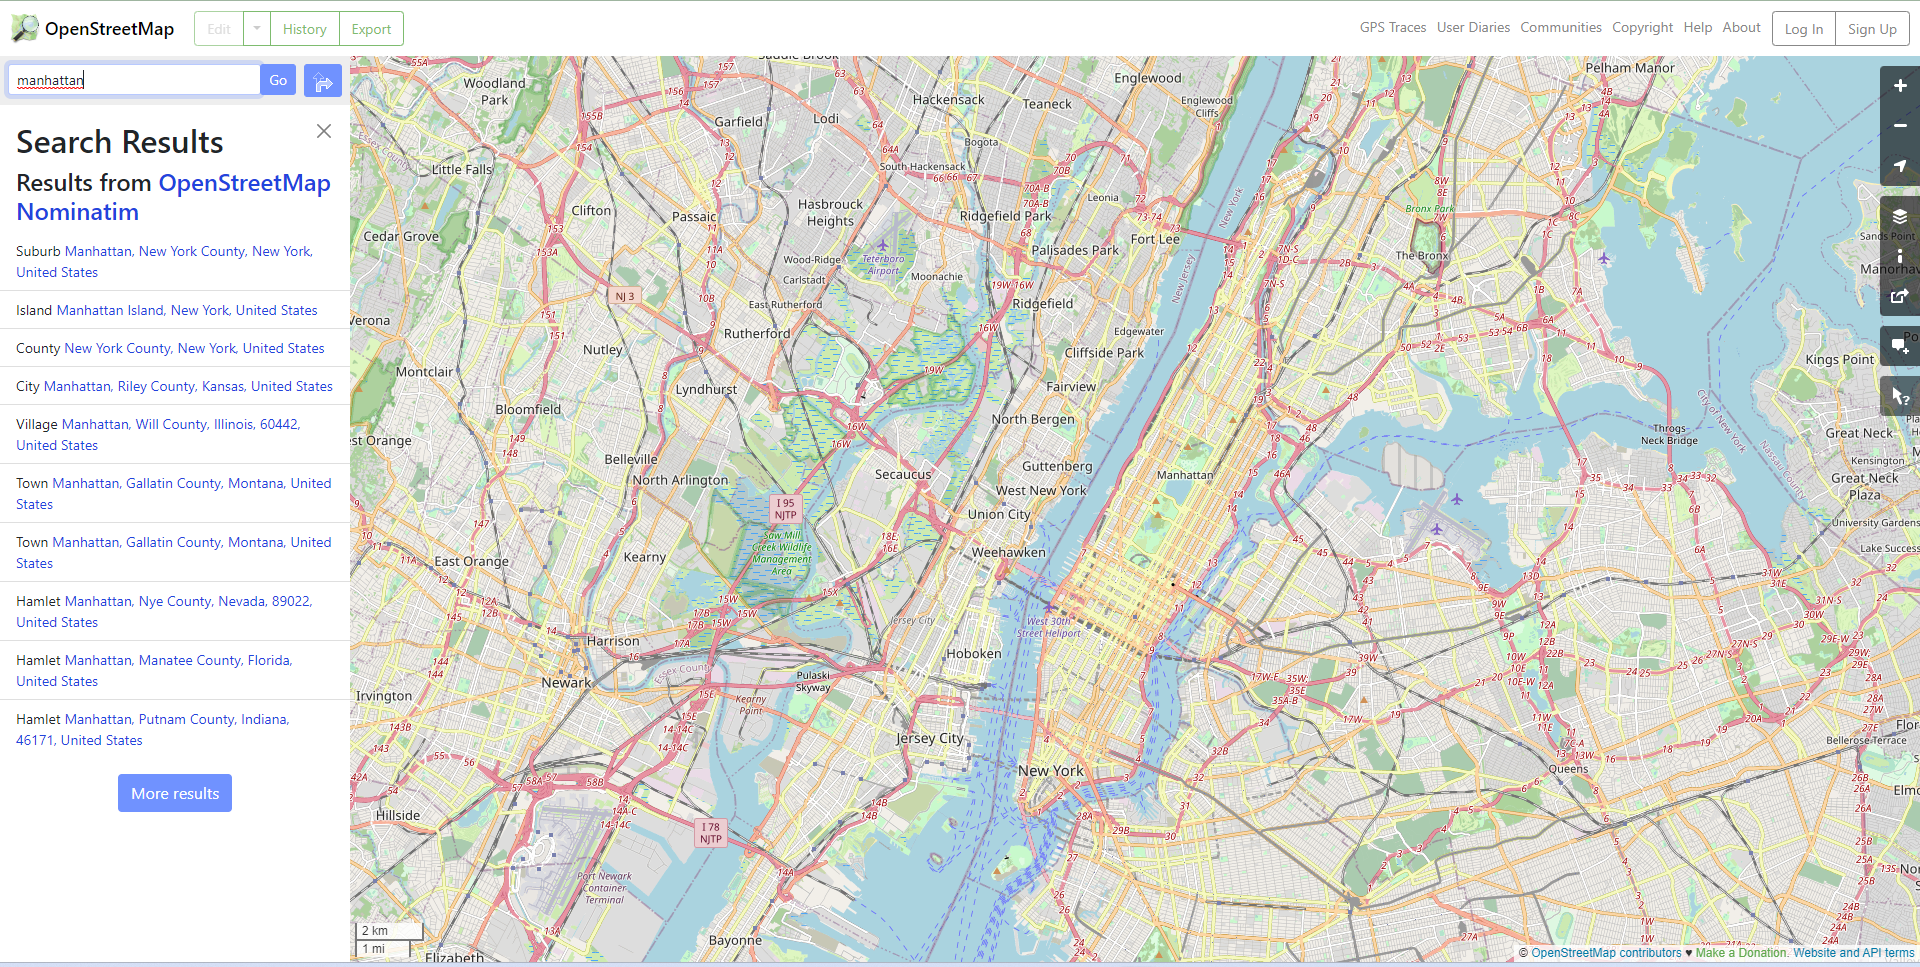
Next, we can click on “Export”.

We now have the following view – not only do we want to save the coordinates under “Export”, but we also want to use the “Share” icon (to the right of the screen) to open the window that would allow us to download the image. It may take a few minutes for the image to download.
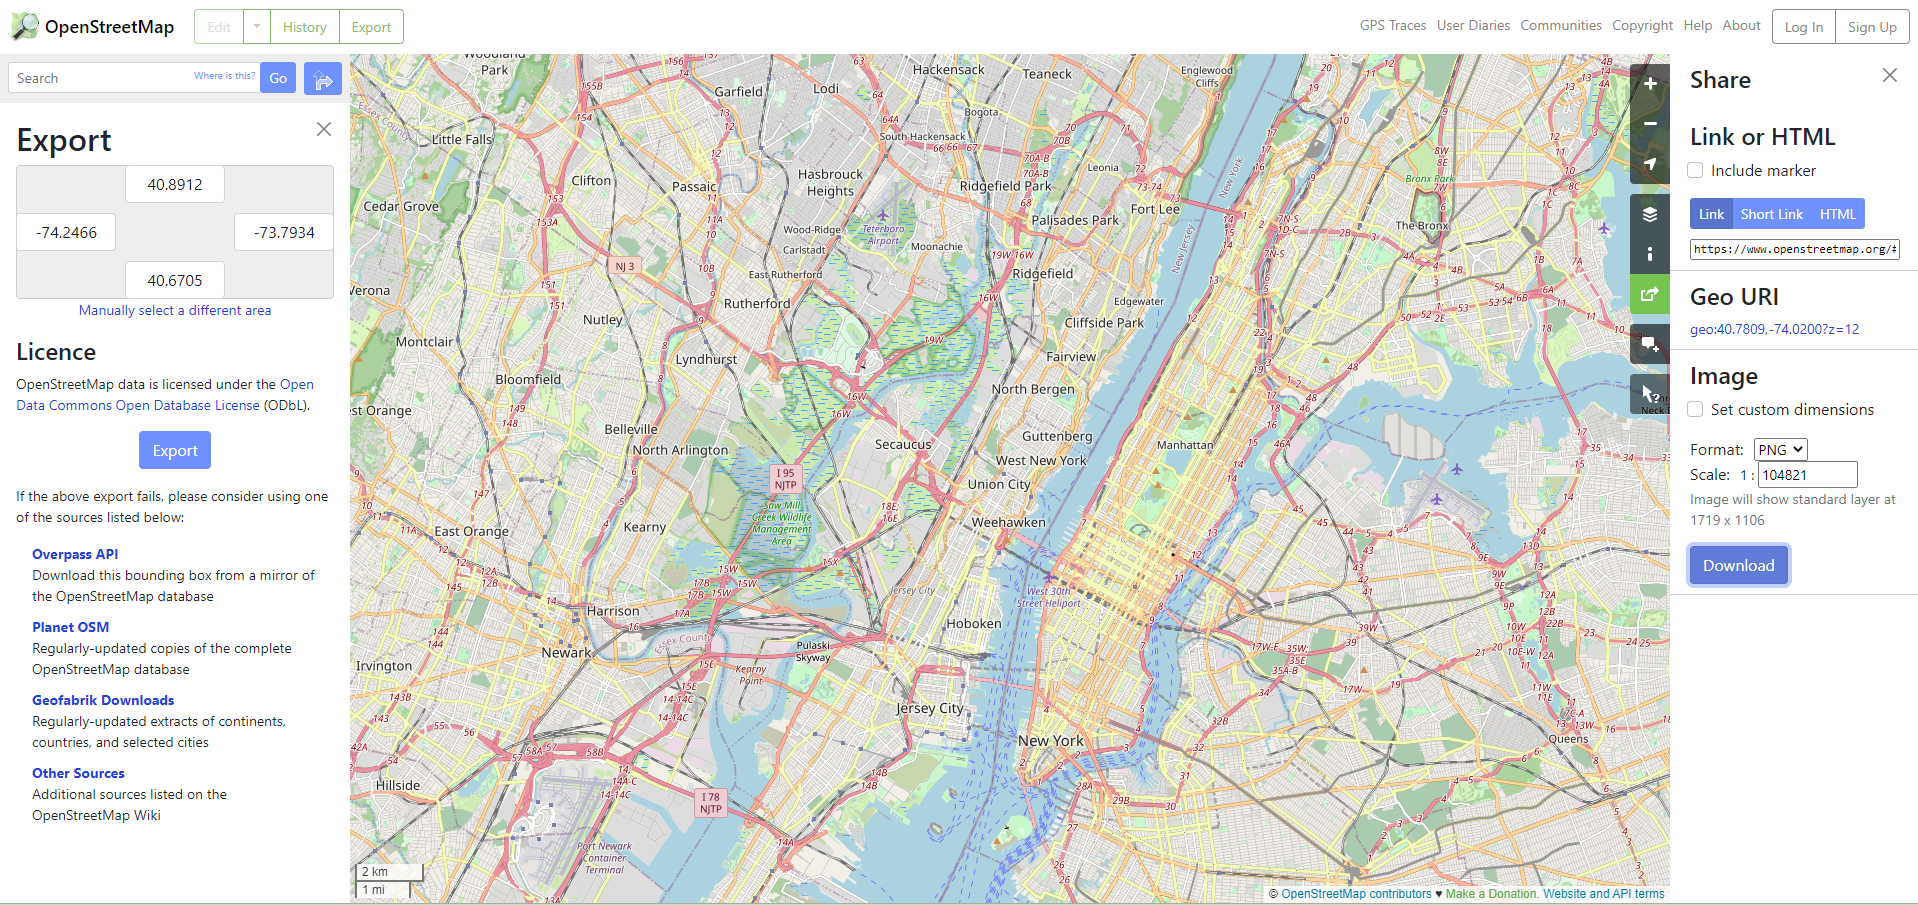
After downloading the image we can return to Tableau. Under the Map tab, we can select “Background Images” and select our data source. This will open up a dialogue box that will contain our background image(s). Click on “Add Image…” to add our downloaded image and corresponding information.
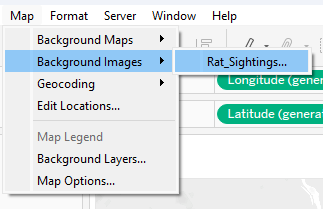
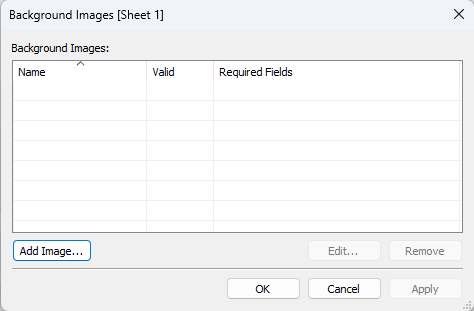
In this new dialogue box, we will add “Name”, add the file path to the image we downloaded, and input the values for “Left”, “Right”, “Bottom”, and “Up” based on the export coordinates we saved from earlier. After doing so we can click on “Apply” and then “OK” and then “OK” again.

But wait, where’s the new map? We can’t see our new background because we are still using the Tableau background map view. To turn this off, go to the Map tab, and select “Background Maps” → “None”.
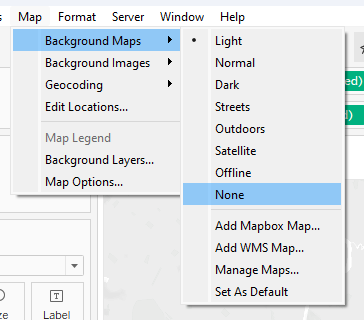
After turning off the map, we can now see our new map!
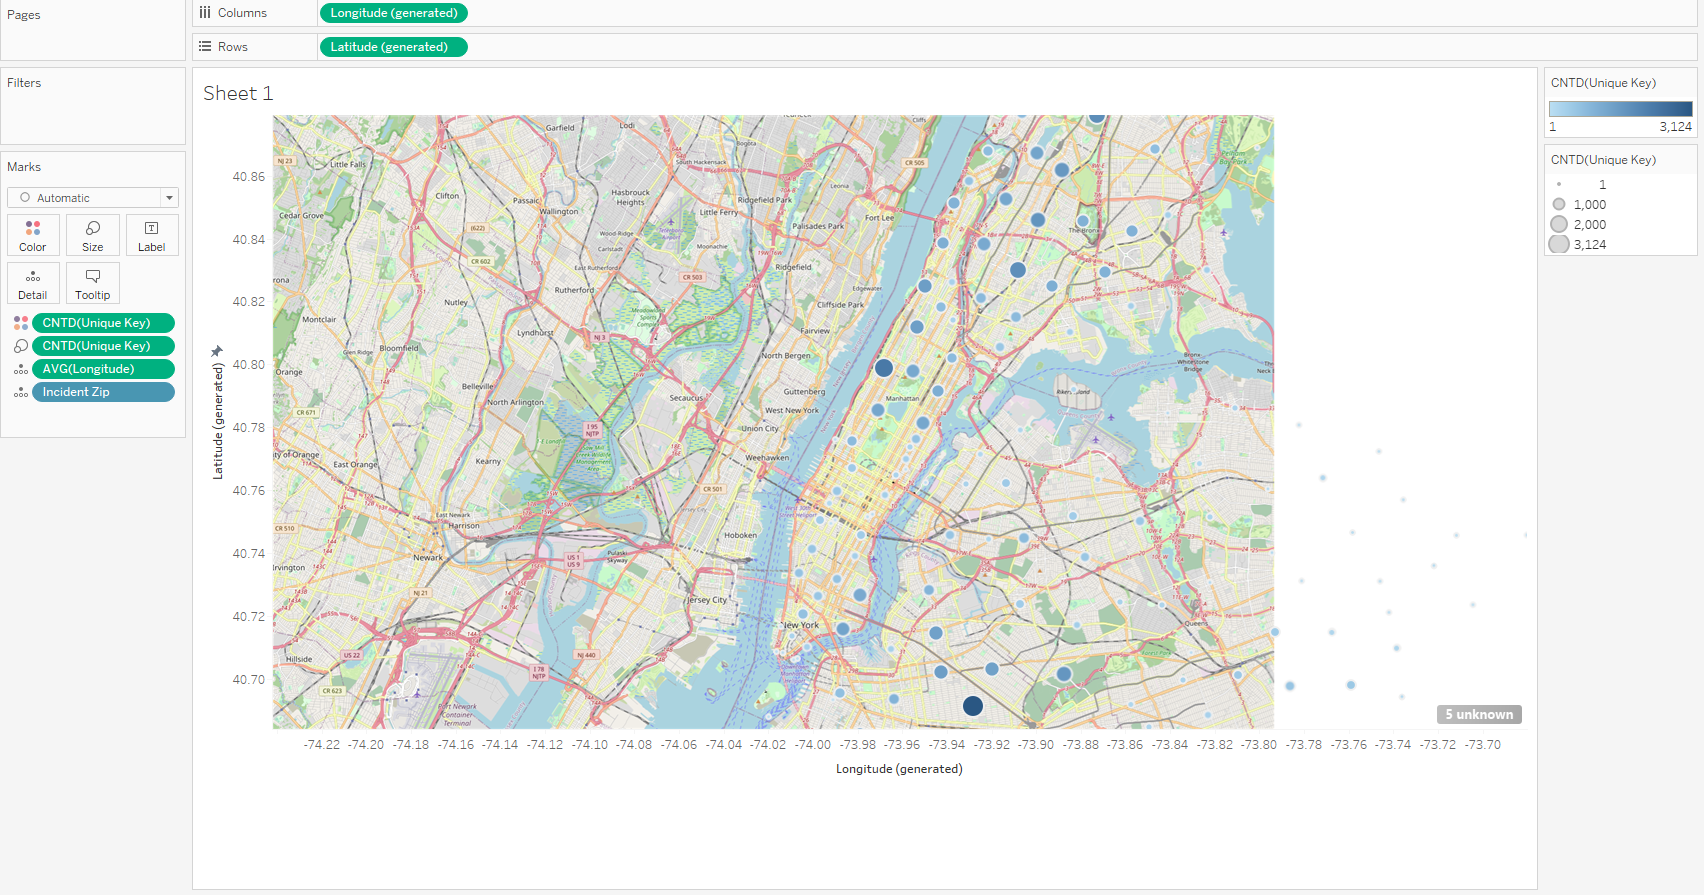
Before we finish, let’s edit our axis for Longitude using the “Export” coordinates for West and East:

And now our axis for Latitude using the “Export” coordinates for South and North:

After hiding both headers you now have your completed map!
