


So this morning our brief was to analyse Uber data in a country of our choice and see how mobility had been affected by COVID. Great, off I go to click the big download data button and I'll be straight on my way to building the best dashboard ever, right...? (until, Andy decided to change the brief about an hour into the day.)
Our new challenge was to pair up and extract New York taxi data from the link here and build something insightful. The catch however was that the file format of the data we needed was in parquet (what on Earth is that?) so data preparation might take a lot longer than anticipated when working on the first brief.
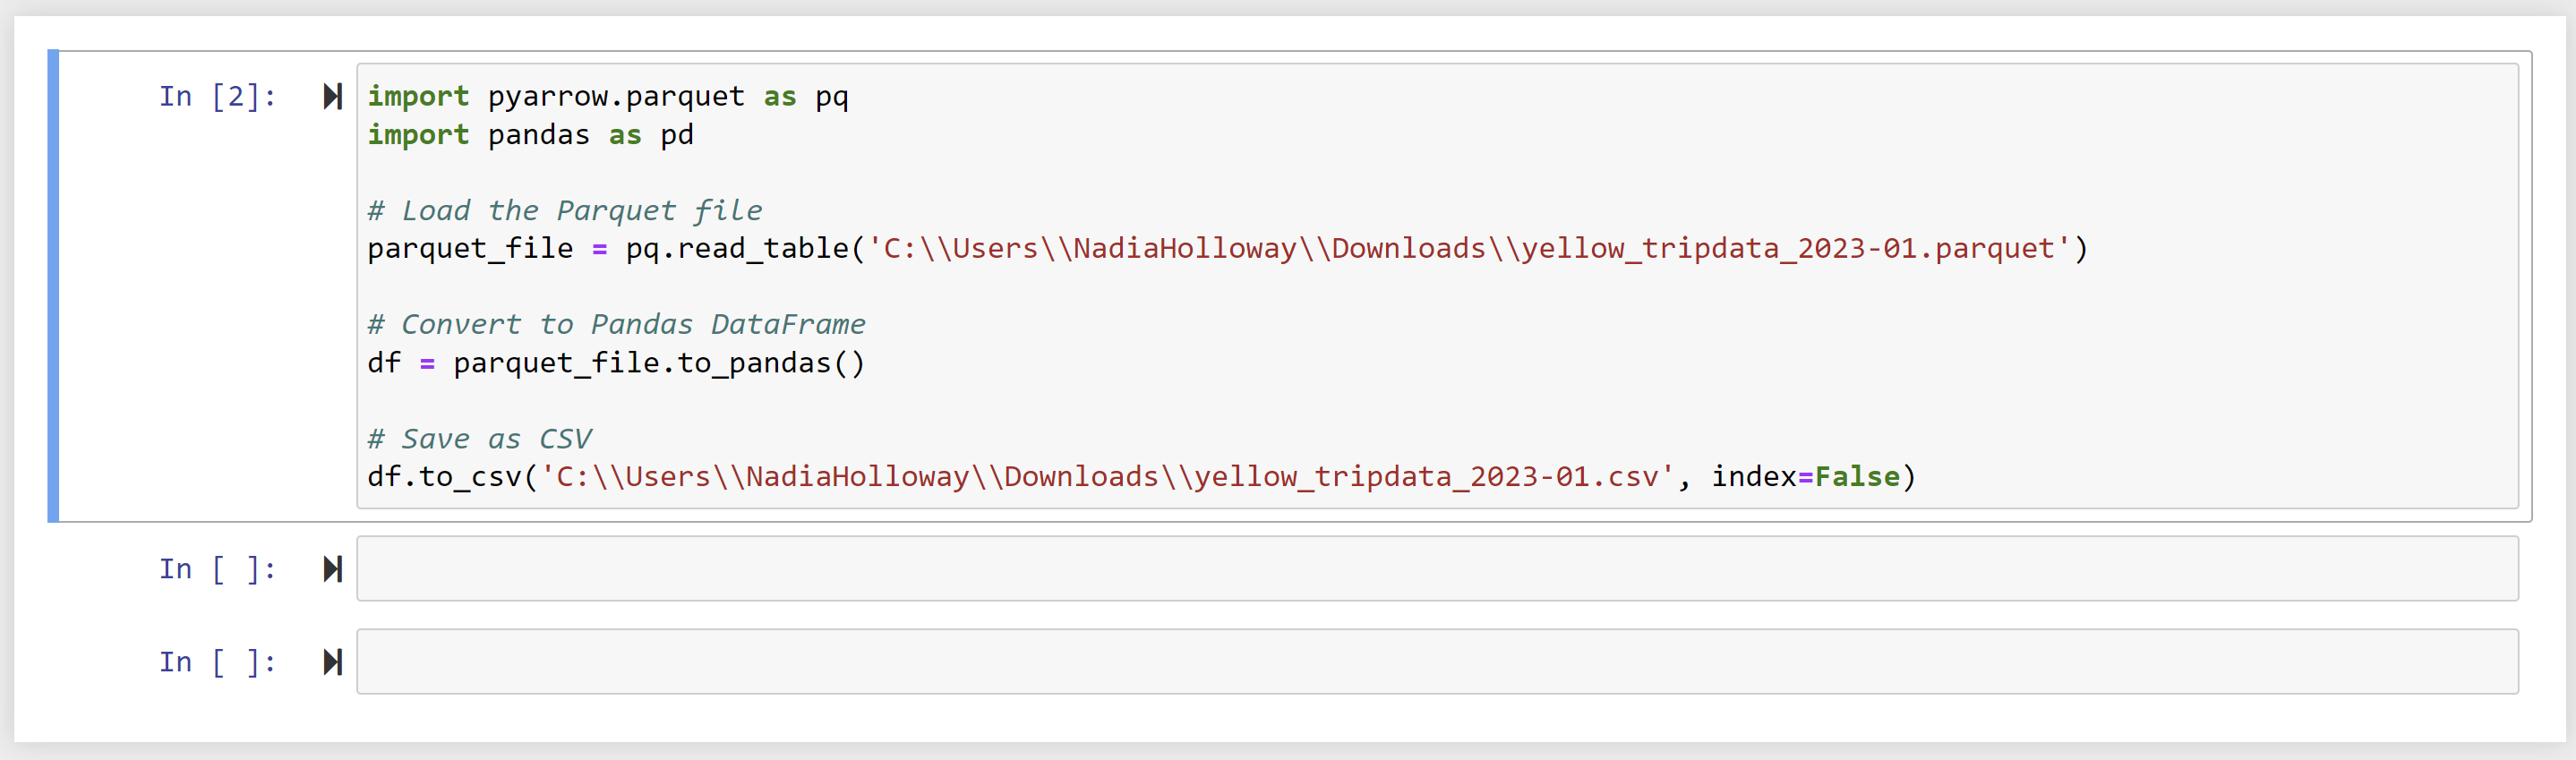
ChatGPT was our best friend here. We managed to understand that this file format could be converted to a csv using Jupyter Notebooks, which was fairly easy to do once you understood what ChatGPTs riddles meant.
Here was the script we needed to input:
After that Asha and I decided to focus on the impact that the congestion surcharge has had on Manhattan from 2019 (before the surcharge was imposed) to 2023 (after). We actually managed to find some interesting insights, being that the surcharge has significantly decreased the number of yellow taxi rides across all zones in Manhattan.