Dashboard week is a 5-day challenge, each day confronted with a new data set, either given straight out or directed to where to build or capture it from, before investigating and presenting the data in a series of visualizations. Today we were given a total of 3 hours to complete this process.
Today's task, laid out in our Coach, Lorna's, recent blog post, is working with sleep efficiency data, from a Kaggle data set that is presumed false (found here).
As an avid consumer of coffee, I chose to focus on the effect of caffeine consumption on sleep time and efficiency.
The Plan
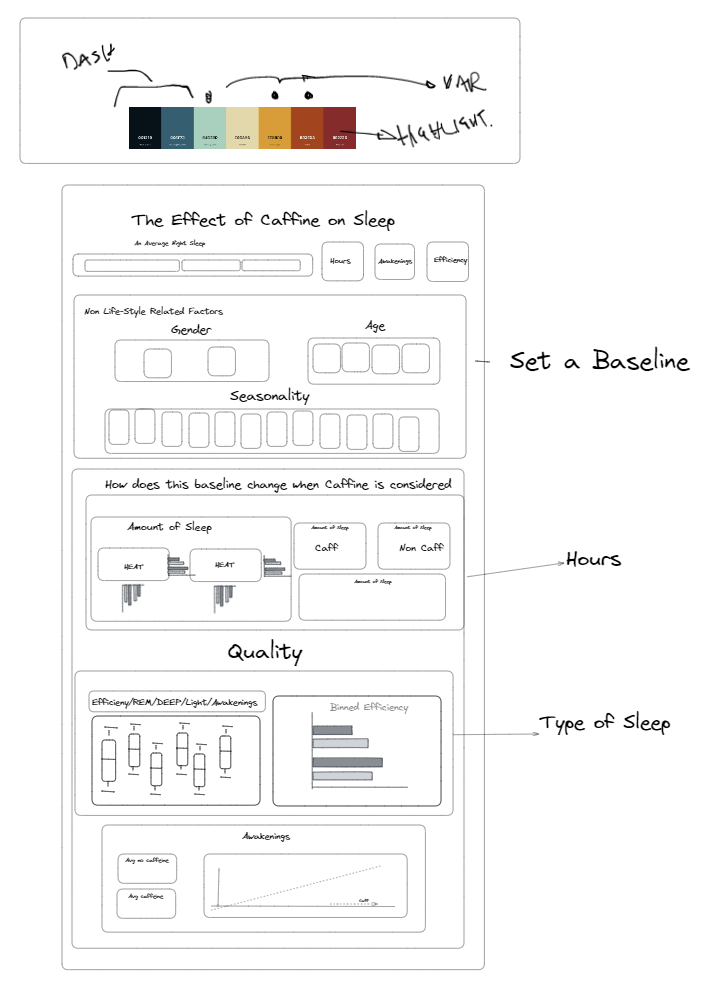
First, I would aim to set a baseline assumption of what an average night's sleep could look like, before delving into caffeine's effect on an individual - on the level of quantity and quality of sleep.
Having made very few dark-themed dashboards at the data school, I chose today as the last day to make a solid attempt.
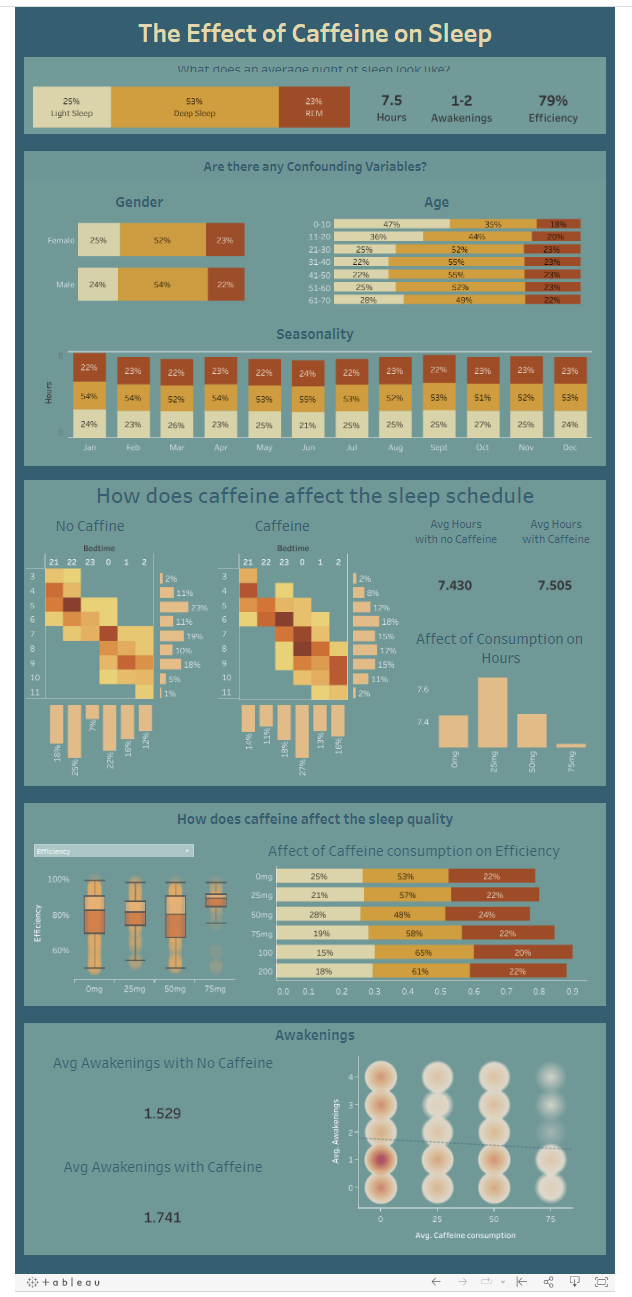
After production, the results showed that with a small amount of caffeine in your diet, you could actually have a longer, and higher quality sleep - however, there is evidence to suggest that this data set is completely fabricated.
There is definitely room for improvement on this dashboard, with colouring, formatting, and commentary. However, with only 3 hours spent on the process, I am happy with the overall turnout.