


The first day of dashboard week had me working on a federal infrastructure dataset. This relates to “public works projects funded by the federal government and designed to build, maintain or upgrade infrastructure systems within the country”; thank you ChatGPT.
My main objective for this project was to be a better storyteller. I feel that when I focus on that aspect; I excel the most. If my visualization doesn't really have a narrative; it’s very difficult for me to explain my graphs and form insights. Thus I decided to strictly focus on the surface infrastructure sector; instead of talking about all the different ones.
My first step was to see if I needed to clean the data. The answer was yes. I mainly modified data types (like changing integers to dates).

In terms of the graphs, I wanted to create a Gantt chart to display the start and end times of a project. Although the main setback was that there were no date fields related to that. The only ones I found were [Project Pause Start] and [Project Pause End]. This related to a time where a project was on halt/break. So I decided to find the Datediff by day between these dates; to show the average break time of a project as a BAN (This will have a meaning later.)

Then I decided to create a timeline with the dates I had; [Milestone Target Completion Date] and [Milestone Actual Completion Date]. These showed the different checkpoints of a project. For example, if an infrastructure project achieved it’s goal of building 10 floors by a certain date; then it would be counted as a milestone. Using these two dates I created a target milestone chart and an actual milestone chart along an aggregated min line. This would allow comparisons of how a project was expected to progress and how it actually progressed.

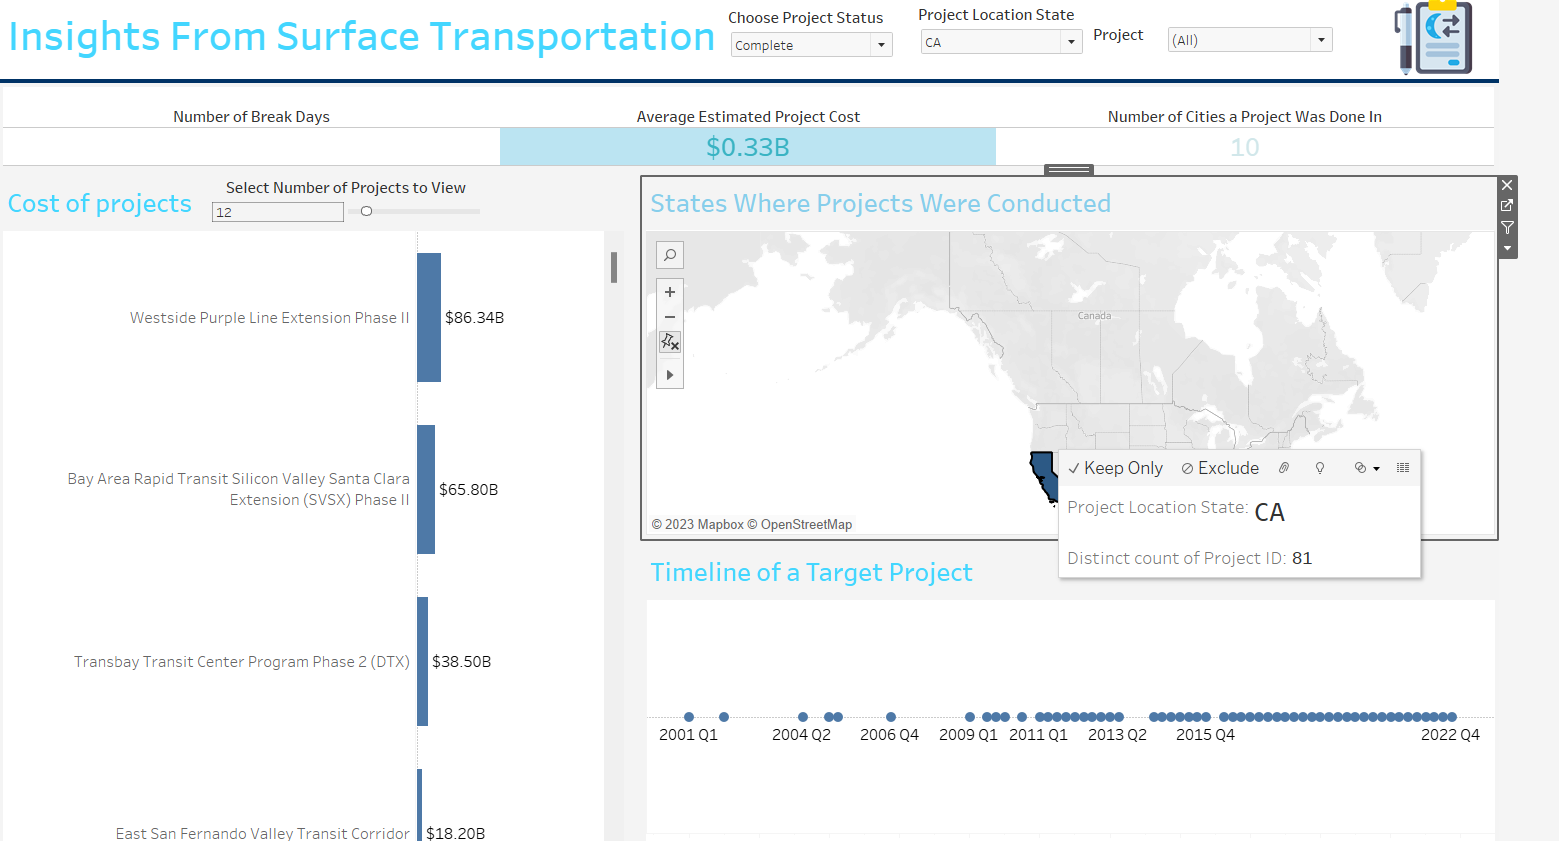
Finally I created a map to show the number of distinct projects per state. From here I’ve noticed that California has the most projects out of every state. After testing out various filters, I came up with a hypothesis. If the government were to start another surface infrastructure project; California would be the best place to start. This conclusion is supported by the fact that California has fewer break days (time period where a project was on hold); as well as it has the most completed number of projects at 81 compared to the other states. Even though the cost is expensive; there are more positives in building surface infrastructure projects in California.
In conclusion, I wanted to find insights even before I even started vizzing. Although the biggest lesson I’ve learned is that if I zone in on a specific part of the data, there will be insights that can be gained from that. The narrative becomes much stronger as well because of how well the charts have been made and organized.