


LOD’s or level of detail in Tableau always gave me nightmares. To be completely honest, anything with calculated fields fills me with dread. Although, I feel that's due to negative assumptions from fear; like bad news creating hysteria about something without proper research. Just to reiterate, LODs simply deal with understanding the granularity (small details) that you’re working with. So to knock off all that doubt, let’s finally deal with LODs!
Little League: Level 1 Fixed
Using the Superstore dataset, we’re going to drop Region in rows and Sales (SUM(Sales)) in columns. Then click the T text icon at the top to see SUM(Sales) next to their respective bars.

What we want is to click the little cross next to Region to get State/Province. This is part of a hierarchy. To not complicate things, think of a team like the Lakers. That is like Region (a big umbrella). Now if you look into Lakers you can see the individual players (LeBron or Anthony Davis); this represents State/Province or a category under the bigger category/umbrella Region. You can even go deeper and get into the types of brands that each player is associated with or in this case you dig deeper into State/Province and you get City. But let’s just keep it simple and focus on Region (big category) and State/Province (sub-category under Region).

⬇️

Now lets ctrl (control left click) SUM(Sales) and drag it next to our first SUM(Sales).

Here we see the individual SUM(Sales) of the State/Province. Tableau always applies at the lowest level of detail; so in this case State/Province. Meaning we’re getting the SUM(Sales) of each State/Province; although what we want is the total SUM(Sales) of each Region. For example, every single line in the West will have the total SUM(Sales) lining up with each State/Province. I’ll visually show this and it will make more sense.
Now let’s go back to …
At the top left, next to the Search bar, there is an upside down triangle. Click that and then click on Create Calculated field.

To write an LOD we use:
the {FIXED function (and then) [the level of detail you want to focus on (has to be a Dimension) Region: (and then) how you want your level of detail to be represented (has to be a Measure) SUM(Sales)} Then name it, I named mine “Easy LOD E.G.”
Psst, cool tip. You can left click - drag the Region/Measure into the calculated field box; instead of writing it out!
Now just click OK and you’re almost there.

To quickly find your new calculation, click the funnel icon near the Search bar and click C; for all new made calculations.

Next drop “Easy LOD E.G.” next to the SUM(Sales) on Columns.

Then click the plus icon next to Region to bring in State/Province.

There you go! We have the total SUM(Sales) of each Region next to each State/Province.
Minor League: Level 2 Include
Now that we have the fundamentals out the way; let's focus on the Include LOD function. Let's set up our sheet as is …

Now what if we wanted the AVG of the Segment to be shown? Like …

To do this we first drag our Segment and create a calculated field.

Here we are {INCLUDE function (and then) [the level of detail you want to have that's not in the sheet and only want (a.k.a Segment): (and then) how you want your level of detail to be represented (has to be a Measure) AVG(Sales)}

At the top we see that our new LOD is in sum format, So we are going to right click and select the average measure.

So now what we have is an average of average Segments. This means that we have the average of Consumer, Home Office, and Corporate (what Segments is made of) and did an average on that.
Here is a better visual example in excel..

Minor League: Level 2.1 Exclude
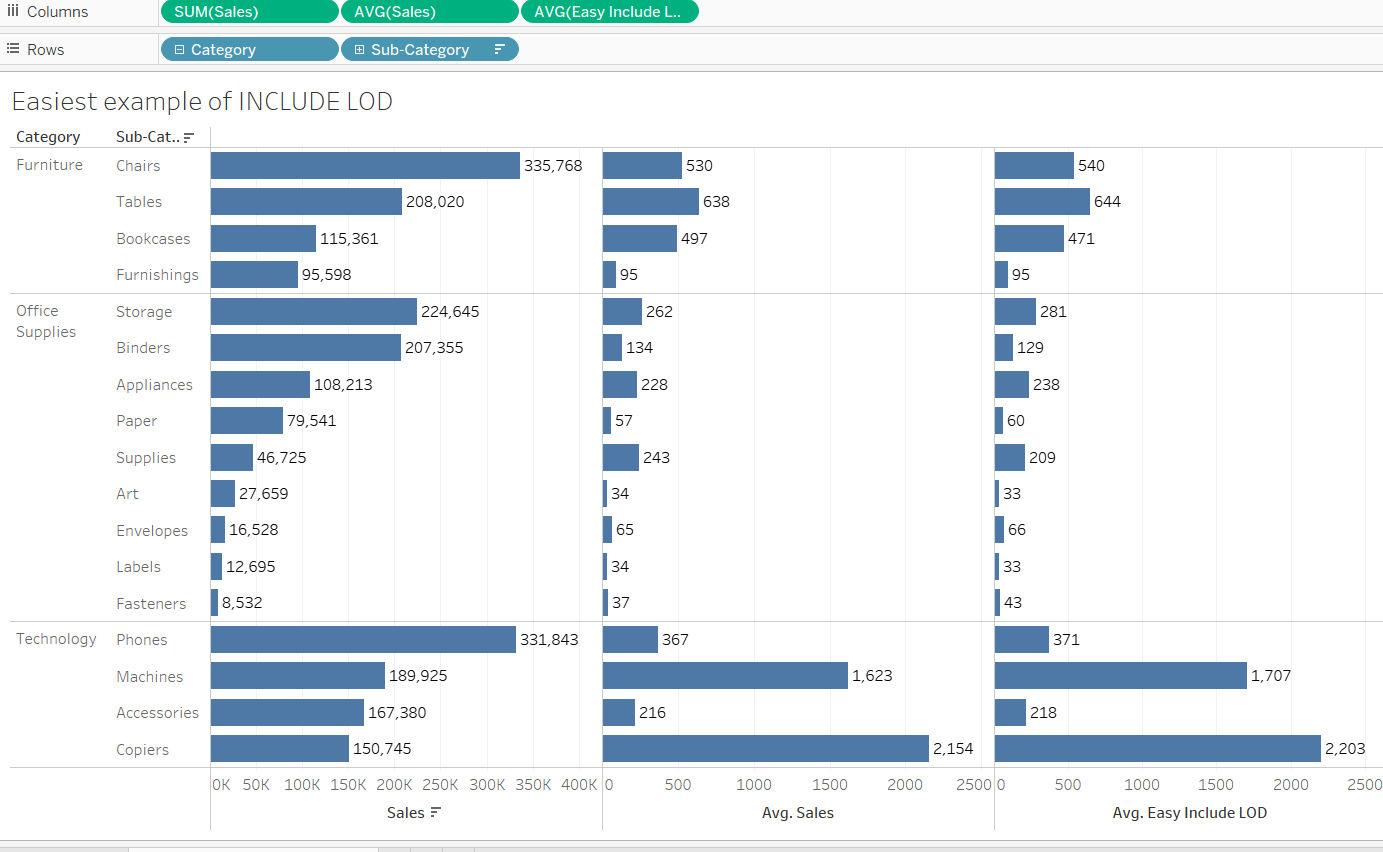
Where almost done I promise! Now lets go back to this …

Here we have a situation where we want to show the SUM(Sales) of Category instead of Sub-Category. So again lets create a calculated field: {EXCLUDE function (and then) [the level of detail you to ignore (a.k.a Sub-Category): (and then) how you want your level of detail to be represented (has to be a Measure) SUM(Sales)}

Now just drag this new calculated field into the columns and remove the second SUM(Sales).

So here all the bars from the first 754,748 to the last 754,748 is calculating the SUM(Sales) at the Category level.
That’s it for me. I hope you understood the fundamental concepts behind these. You will run into more complicated problems when it comes to LODs, but it won't be difficult if you understand the ground rules. Good luck!