


We mostly use filtering in our world of analytics to drill down to contributions of specific fields selected in our filter.
Example: Using region field as a filter, I can only see the amount of sales made in the East per subcategory if I select east.
With Proportional brushing however, if I filter to the east, I will have the opportunity to see the sales amount per subcategory while I also see the sales amount of the other regions. This can be done using set actions.
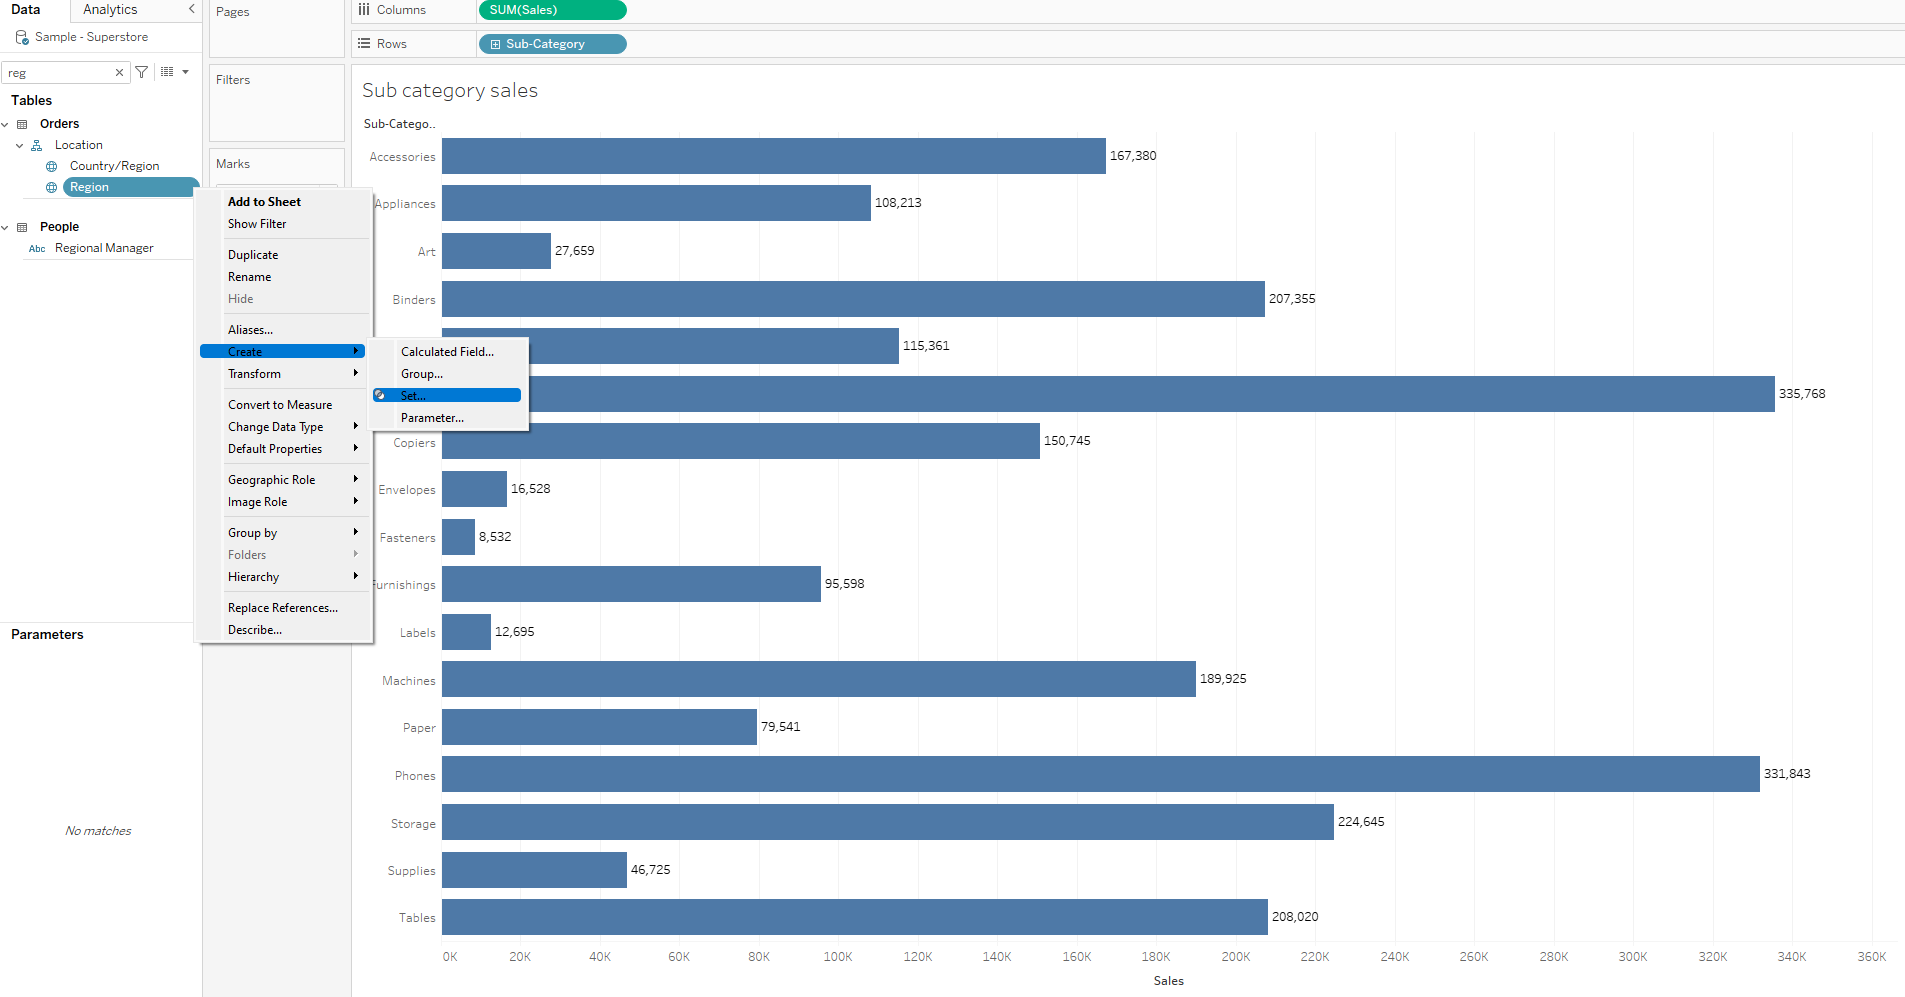
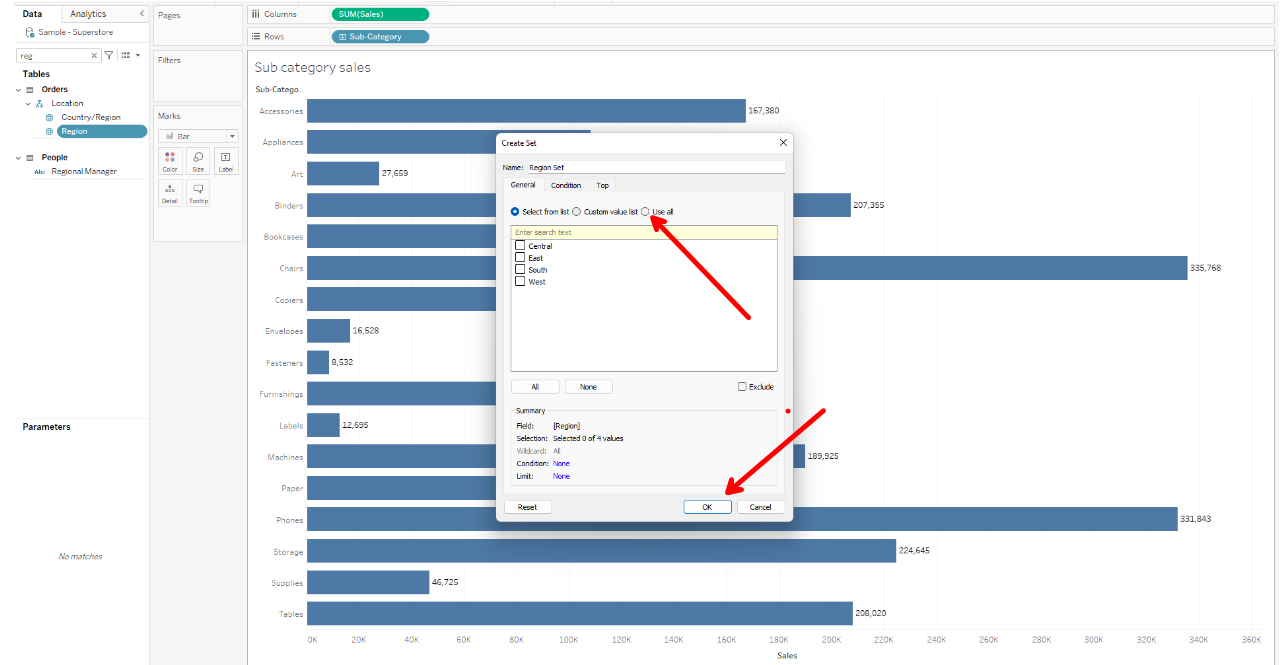
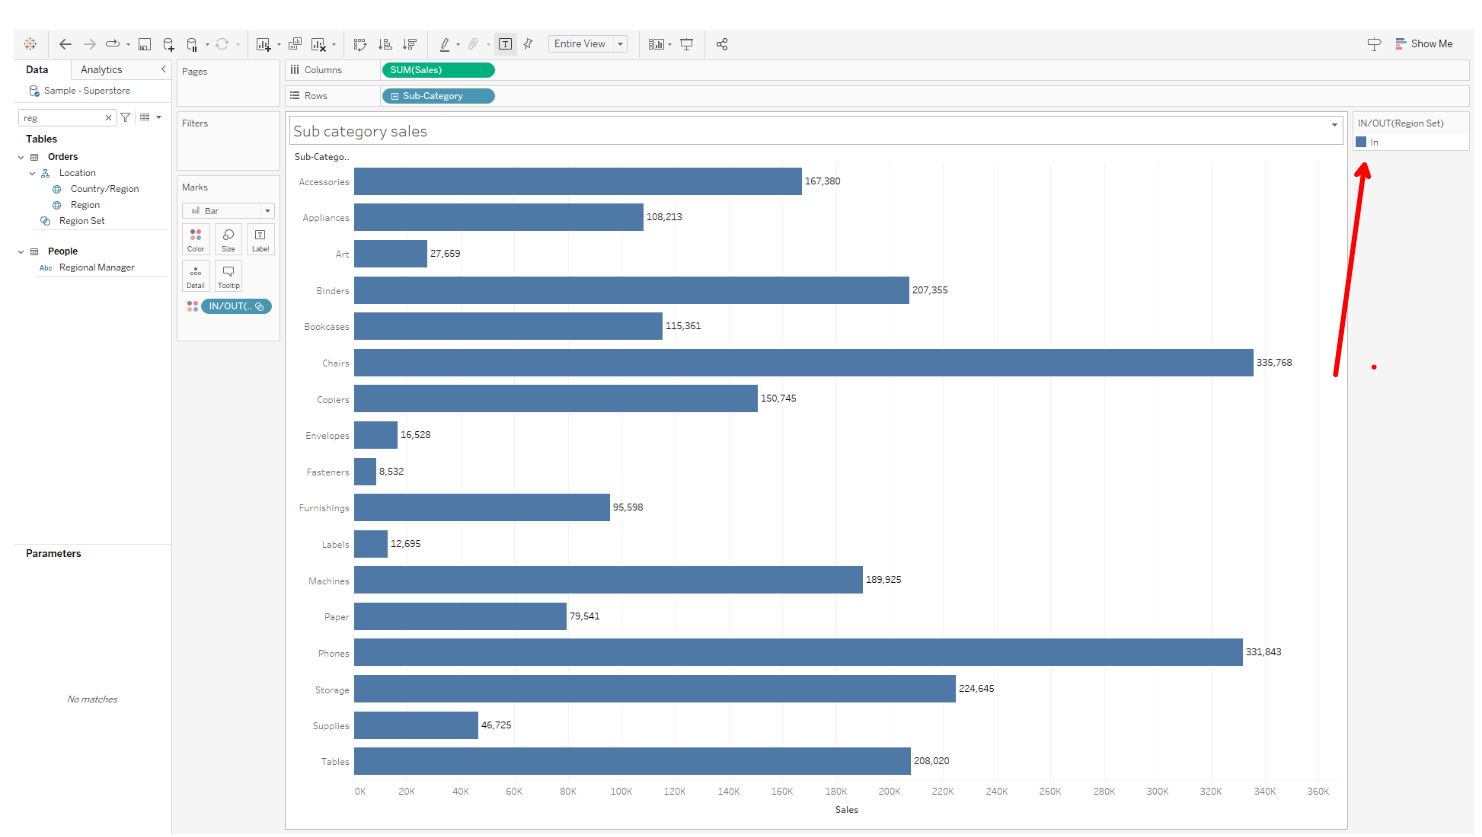
- After creating your sales bar charts per sub-category and region, you will need to create a region set using all fields.
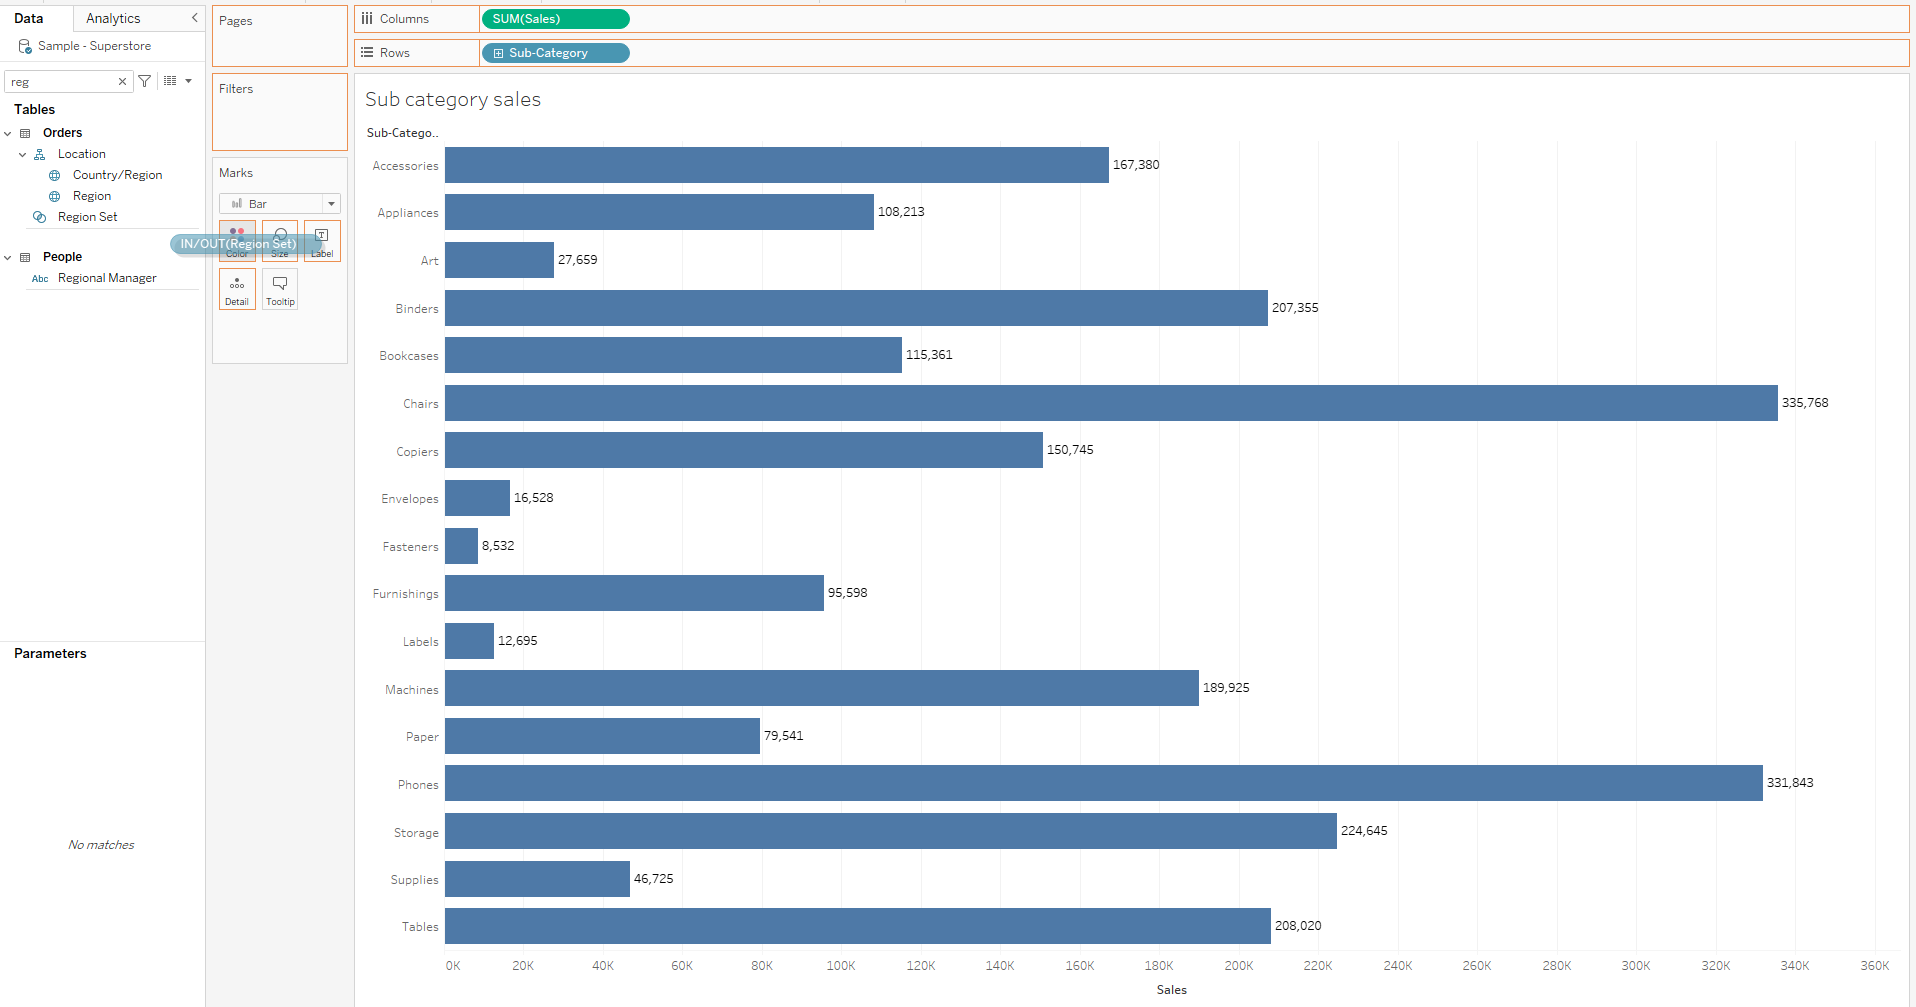
2. Drag Region set unto colour mark. The observation on the legend is that the view contains everything in the set and colour coded blue.
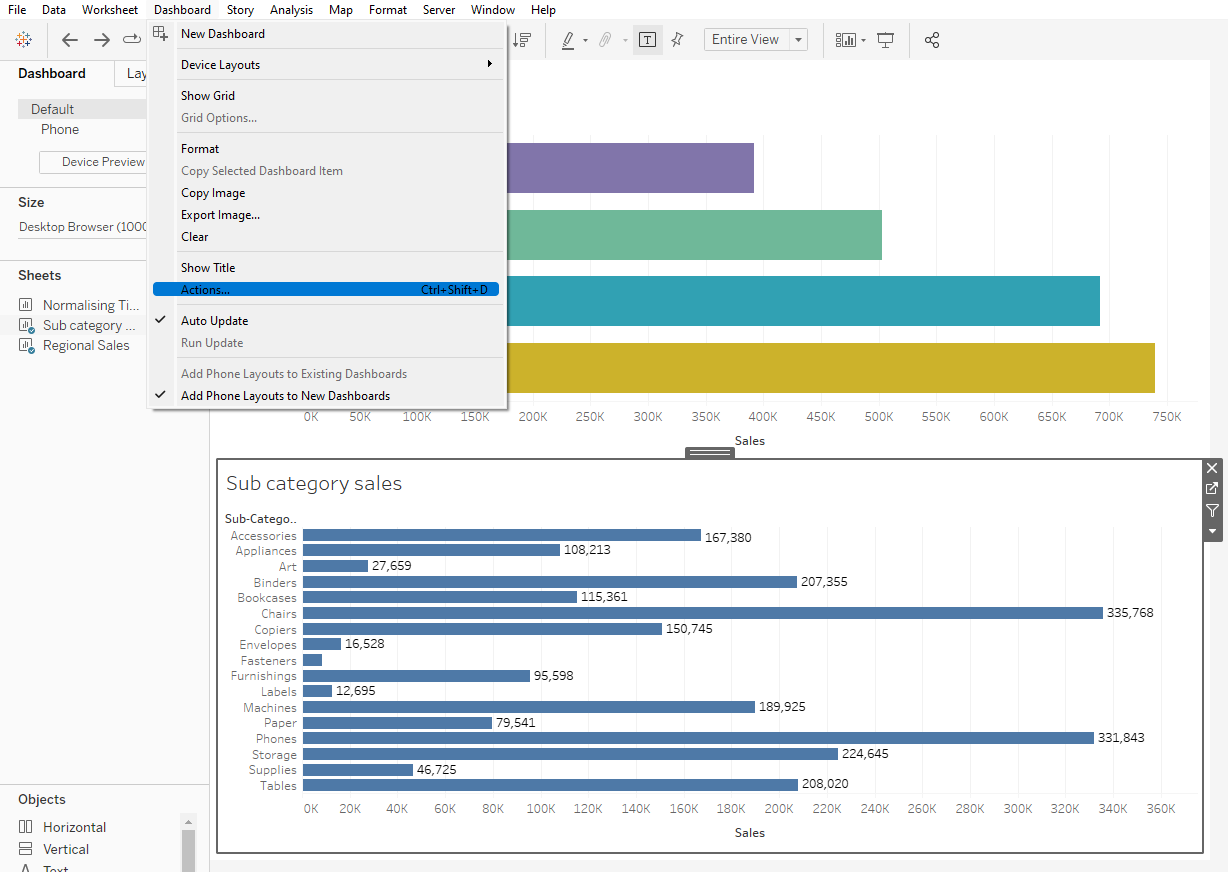
3. After dragging in both sheets created unto our dashboard, we can now create a dashboard set action which will aid in proportional brushing. Click on dashboard and select actions to bring up another window.
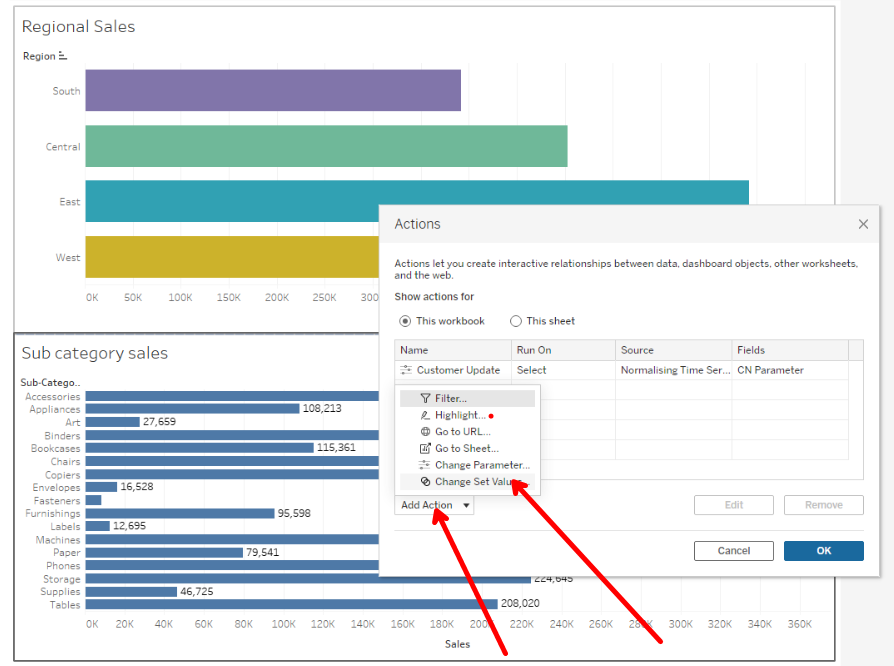
4. In the new window, click on Add Actions and change set values to bring up a new window.
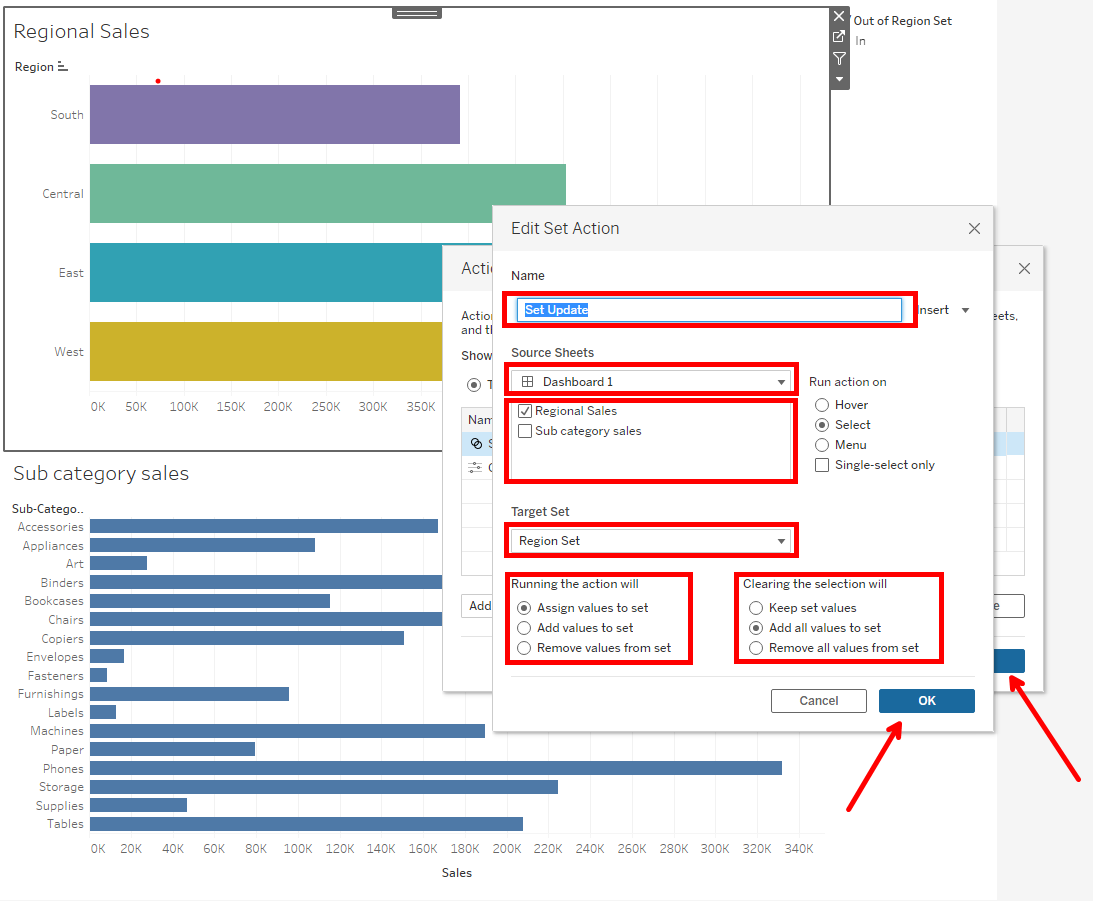
5. In the new window, give the action a name, select the dashboard name and the sheet which is being used as a filter in this case region sales, select the target set as Region set (the set we created earlier on), assign values to set and all values to set when selection is cleared. click ok and click ok on the original window.
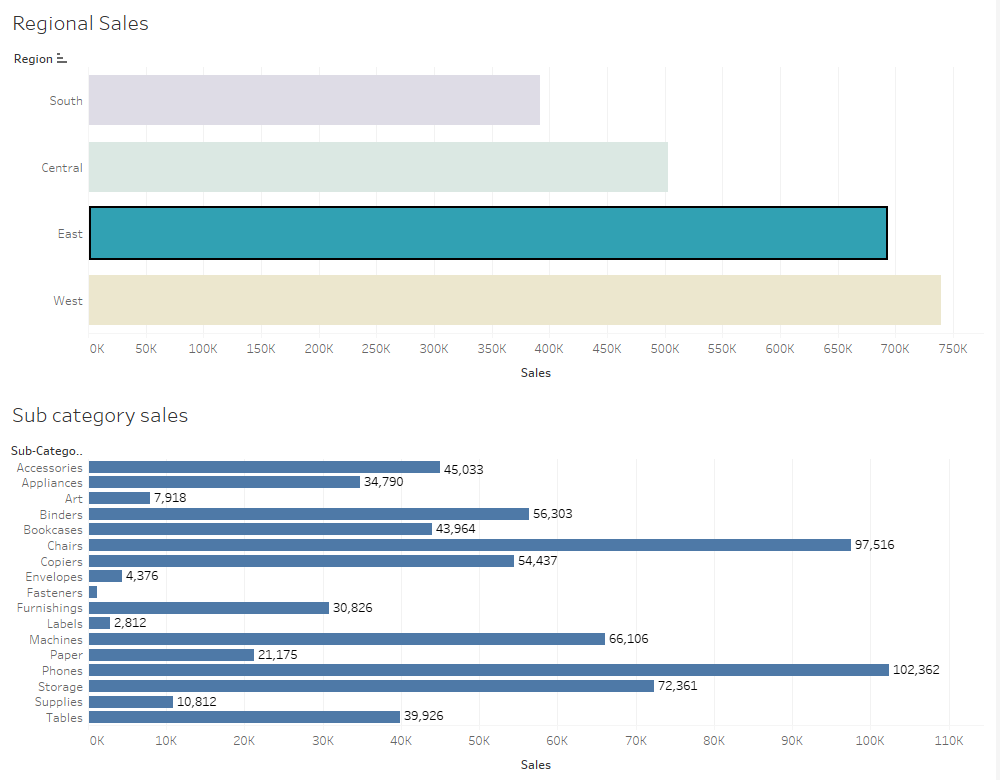
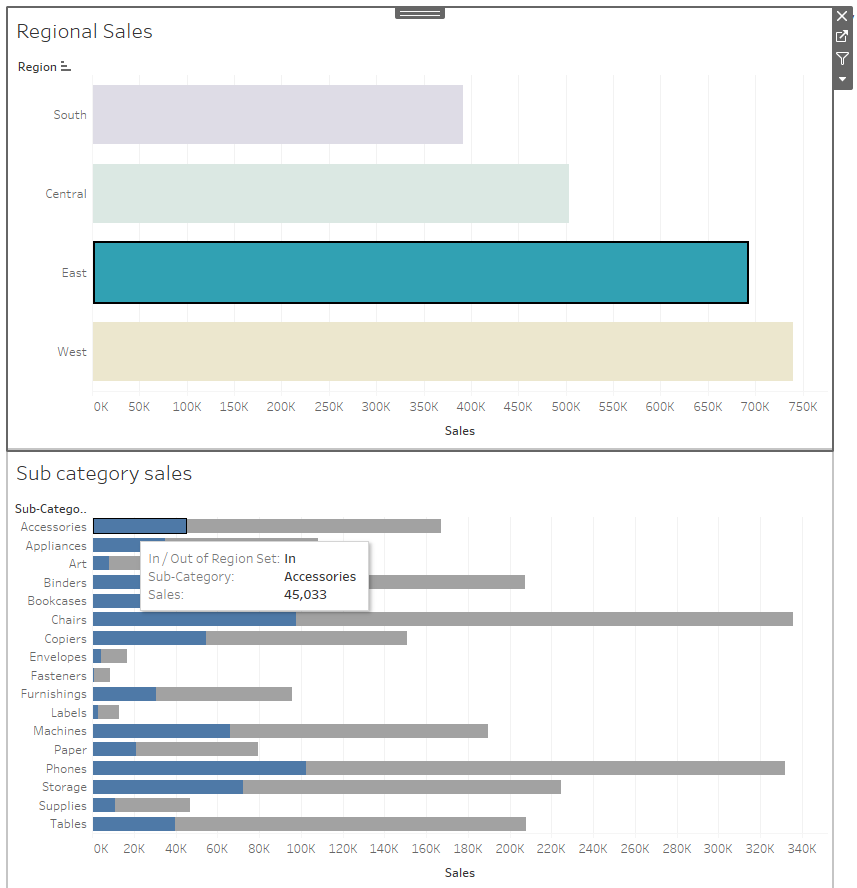
6. Select East to view the outcome. In sub-category sales, we can now see the sales contribution in the east region colour coded blue whiles the other regions are grey in color. Hovering on the blue part of Accesories confirms the 45,033 sales made in the East region.
I hope this was helpful and thanks for reading.