


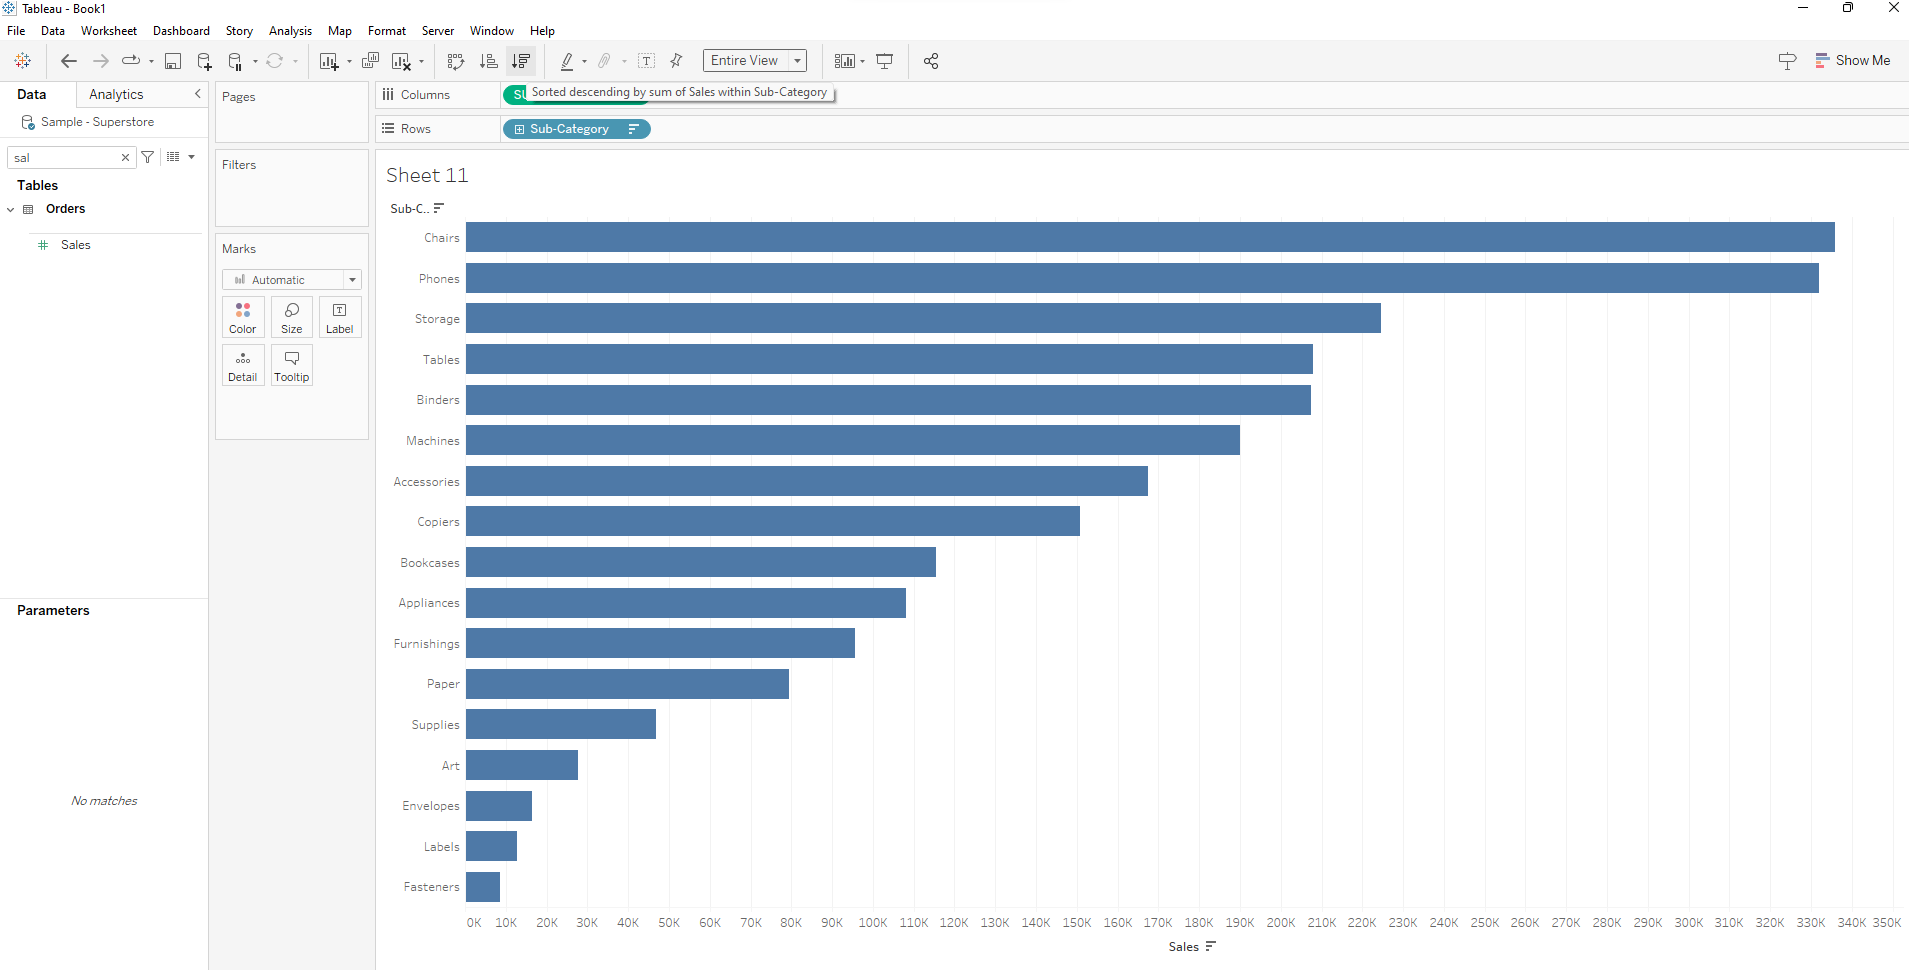
In todays blog, I want to show a different way of positioning labels on a bar chart. That is placing them on top of the horizontal bars. Lets dig in.
- Create a normal bar chart with sub-categories on row, sales on columns and sorted in descending order.
2. Put AVG(0) in the columns shelf to the right of sales by double clicking and keying in the formula.
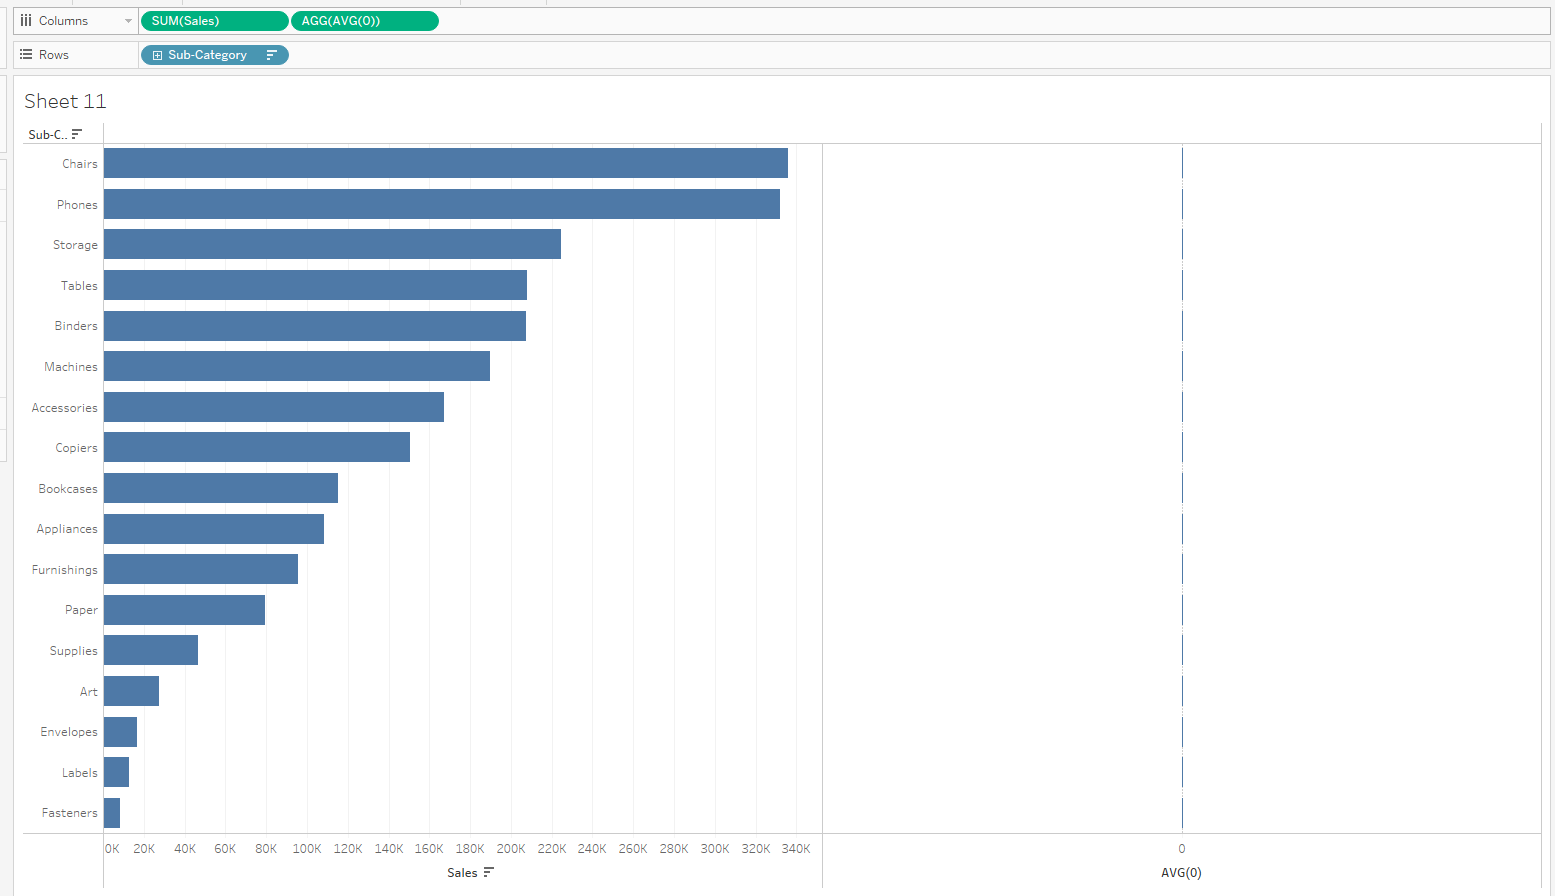
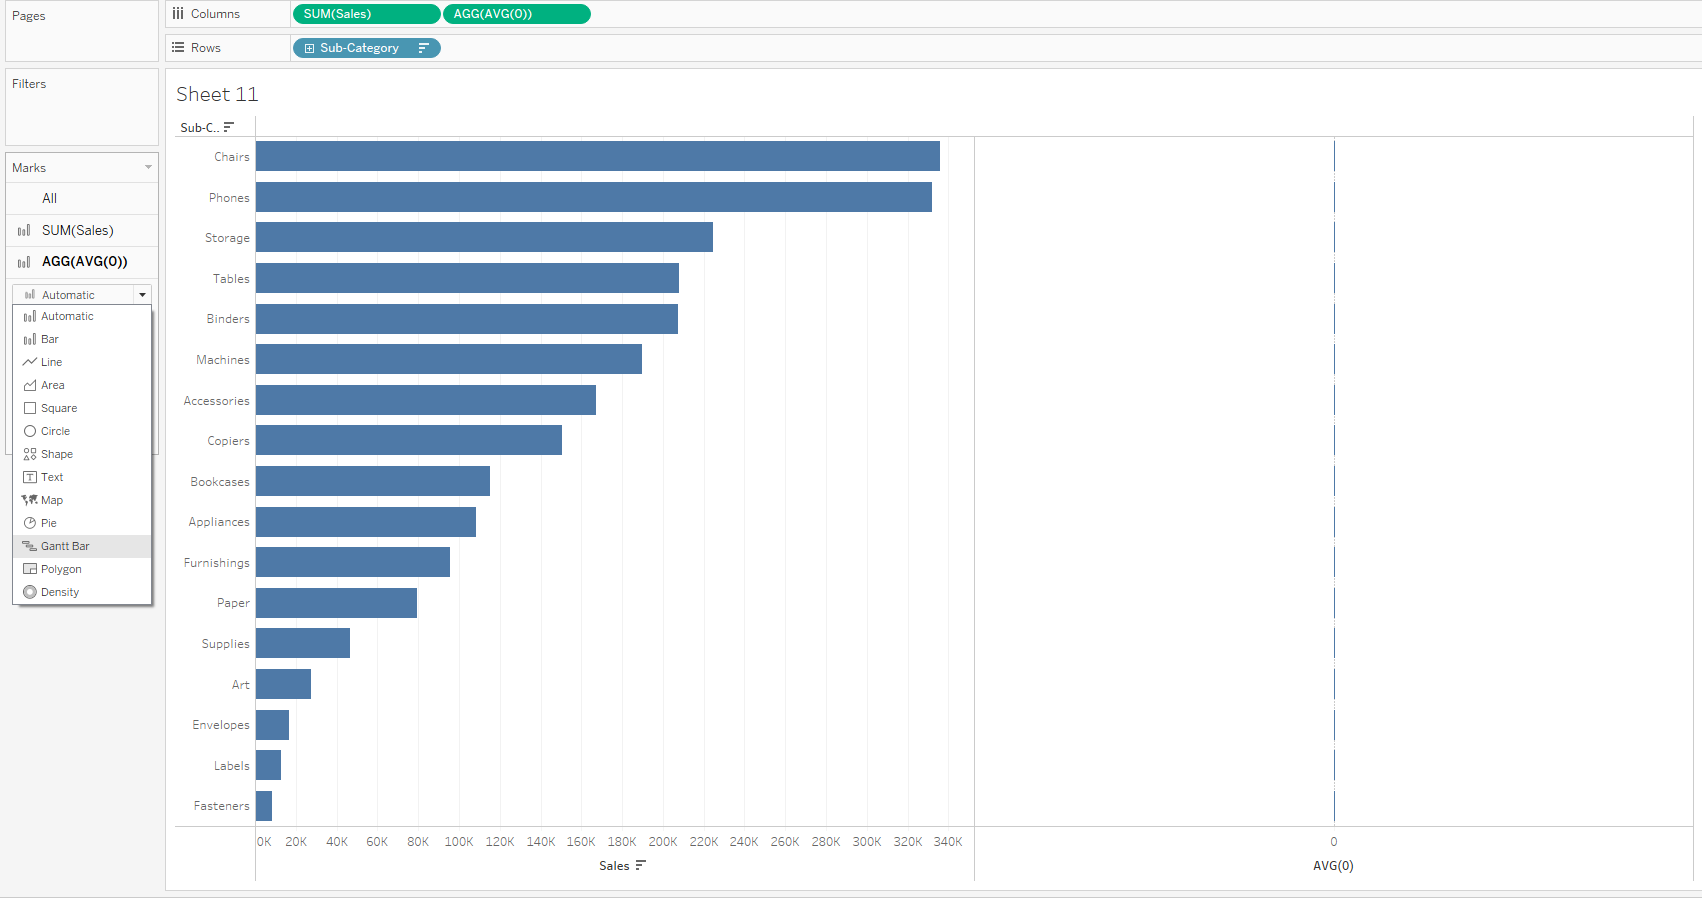
3. Click on sum of sales mark and change from automatic to bar.

4. Click on AVG(0) mark and change from automatic to Gantt bar.
5. Click on AVG(0) in the column shelf and select dual axis
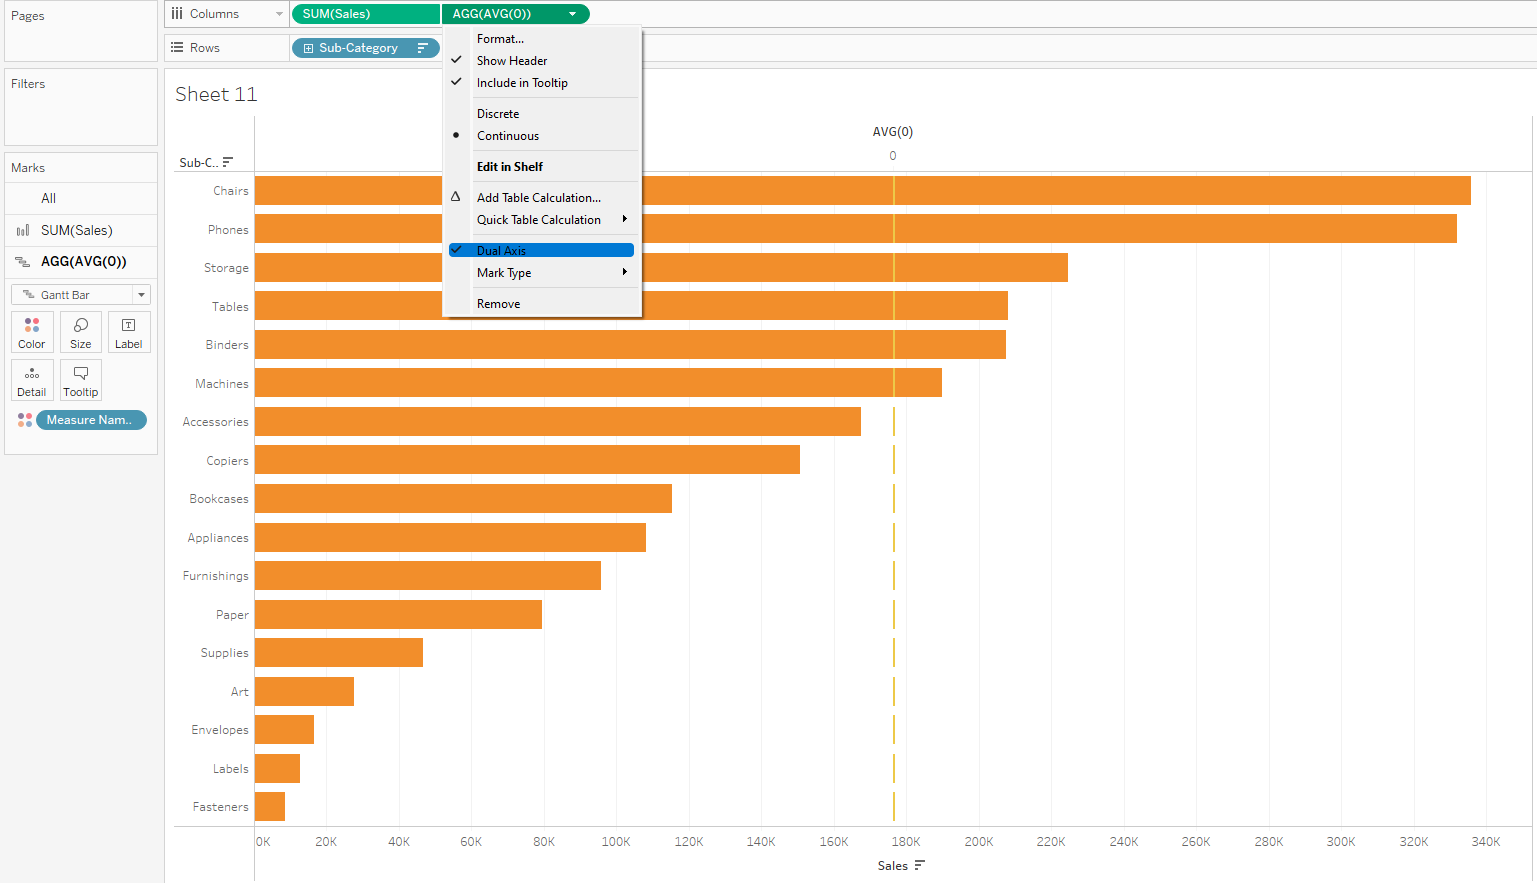
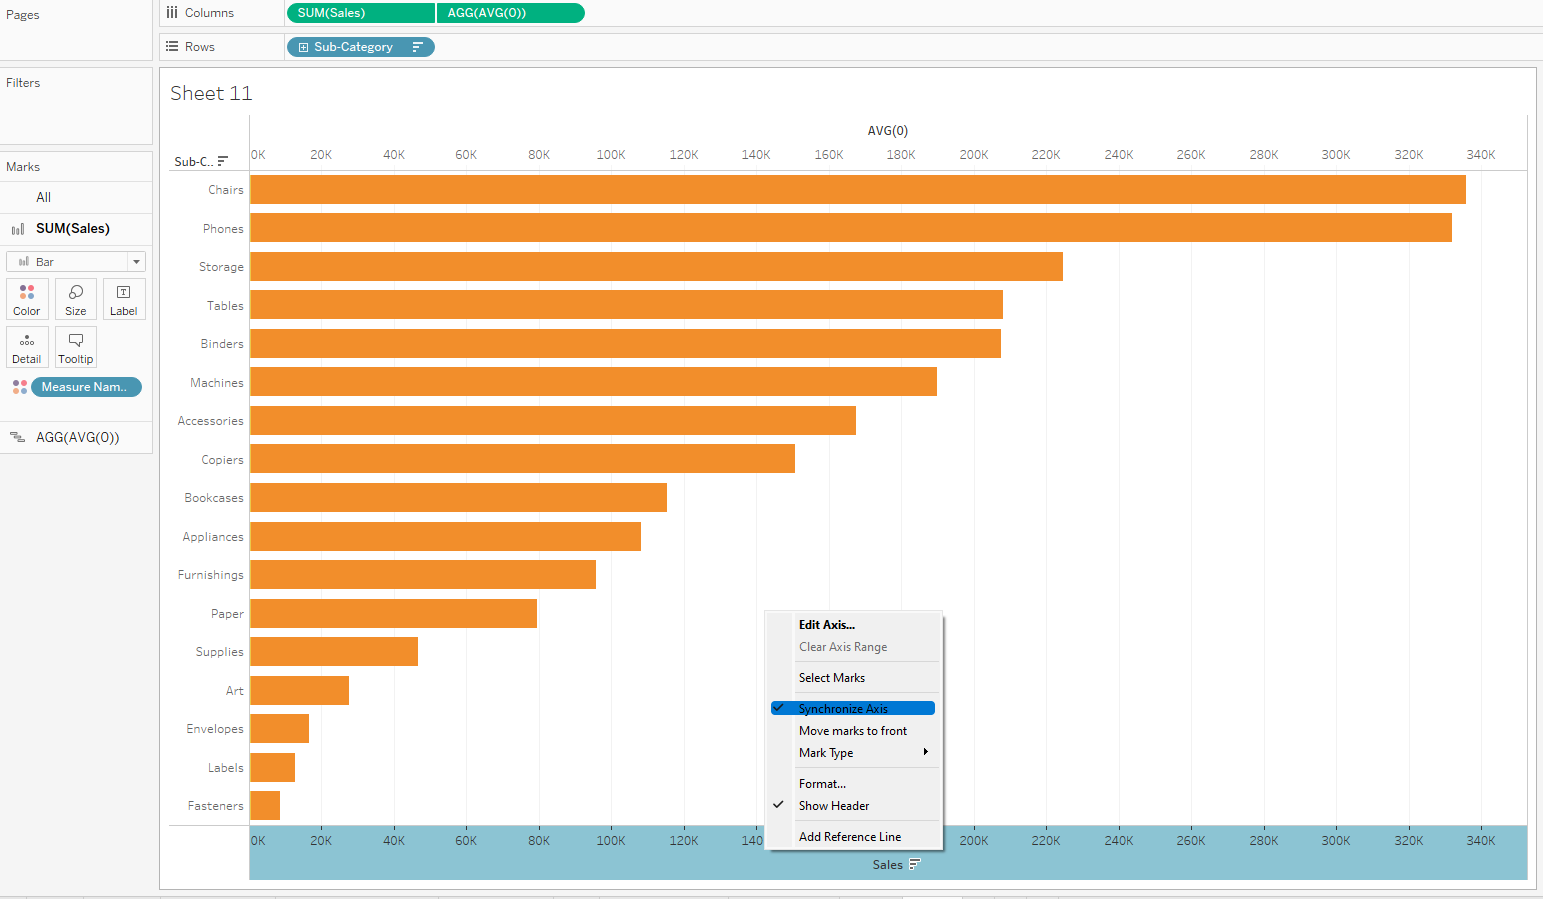
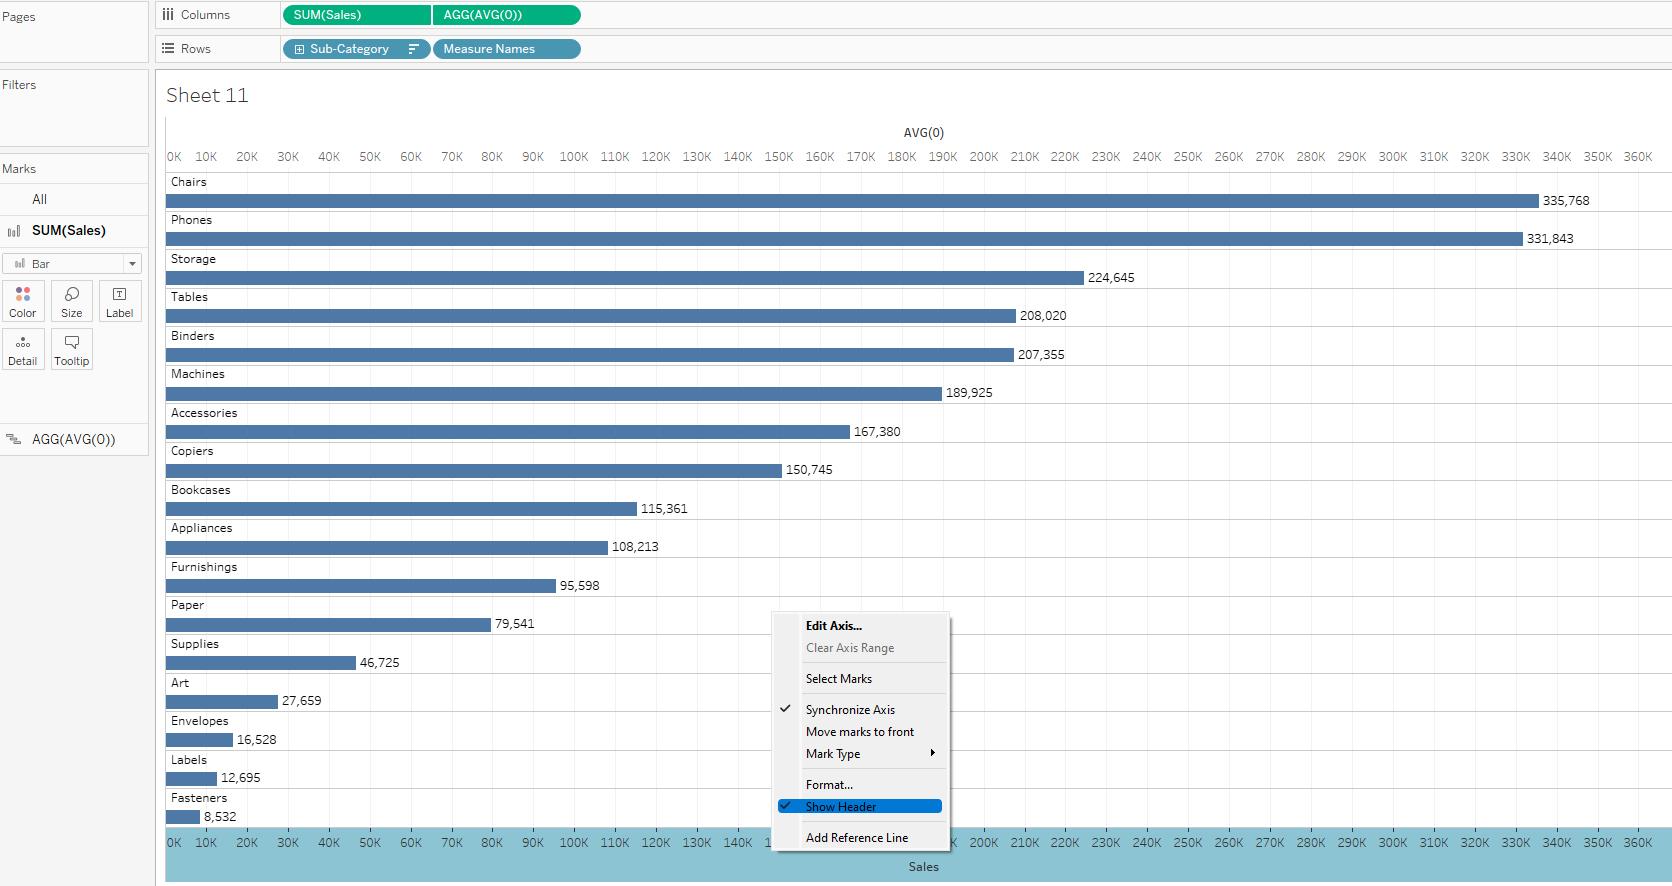
6. Right click on the sales axis and synchronize.
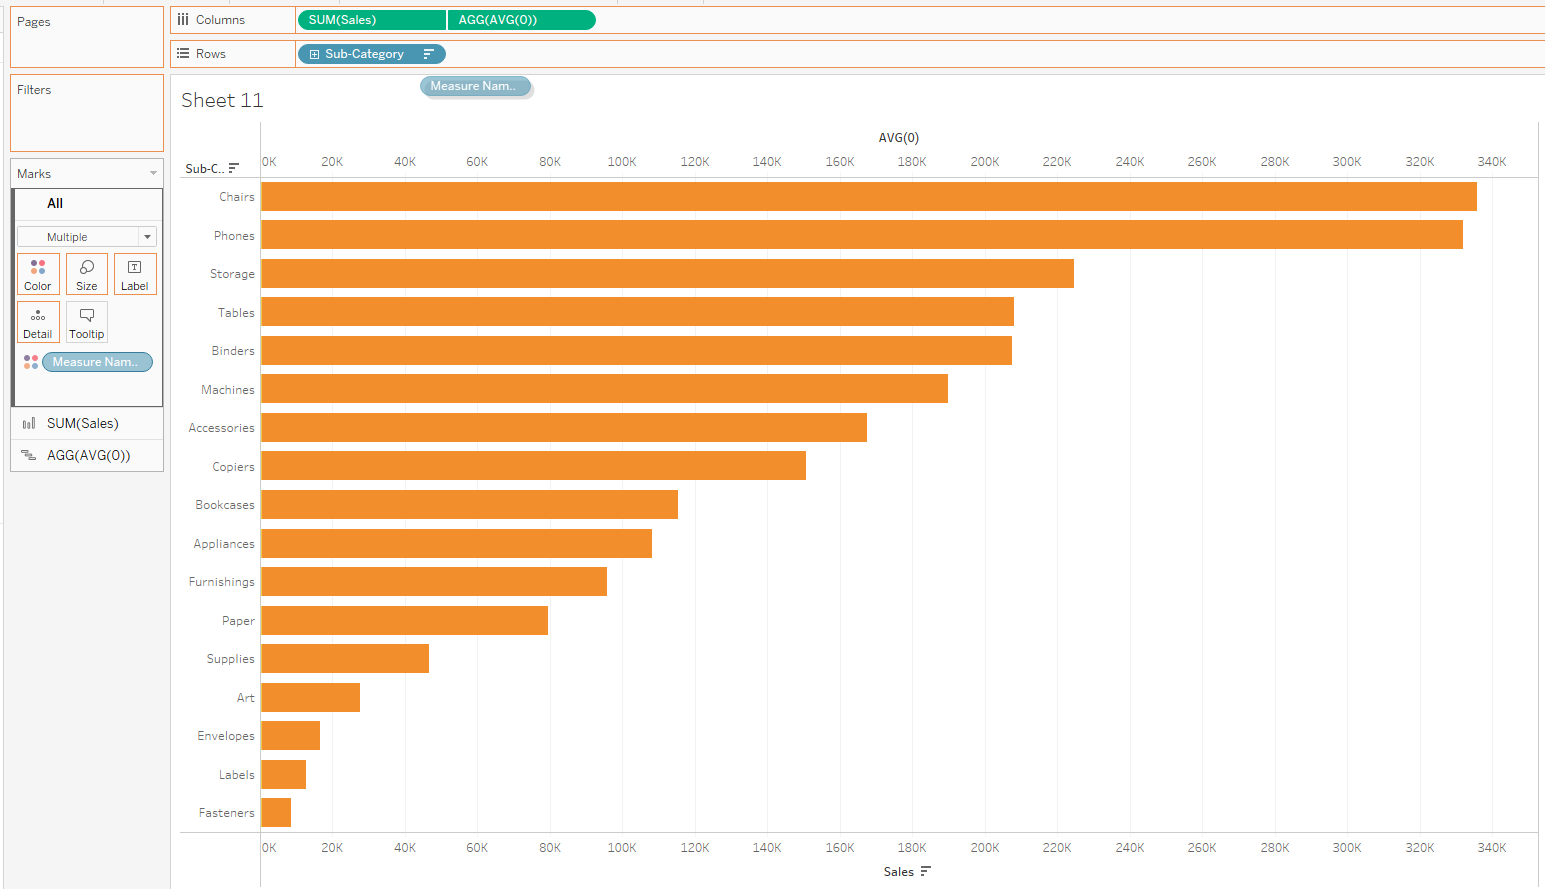
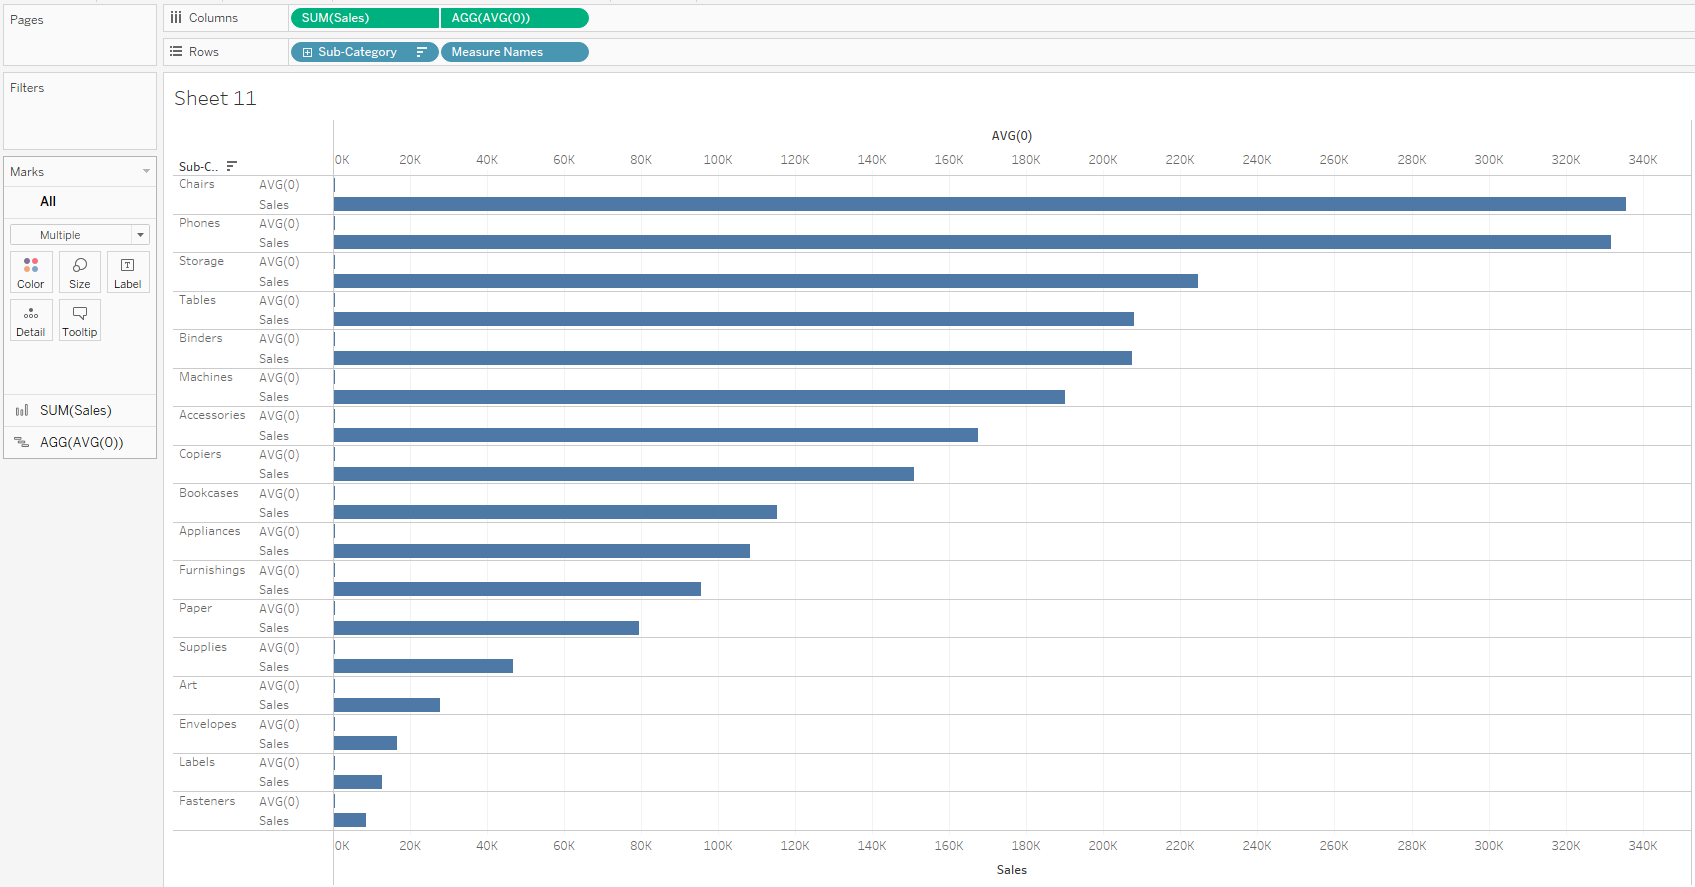
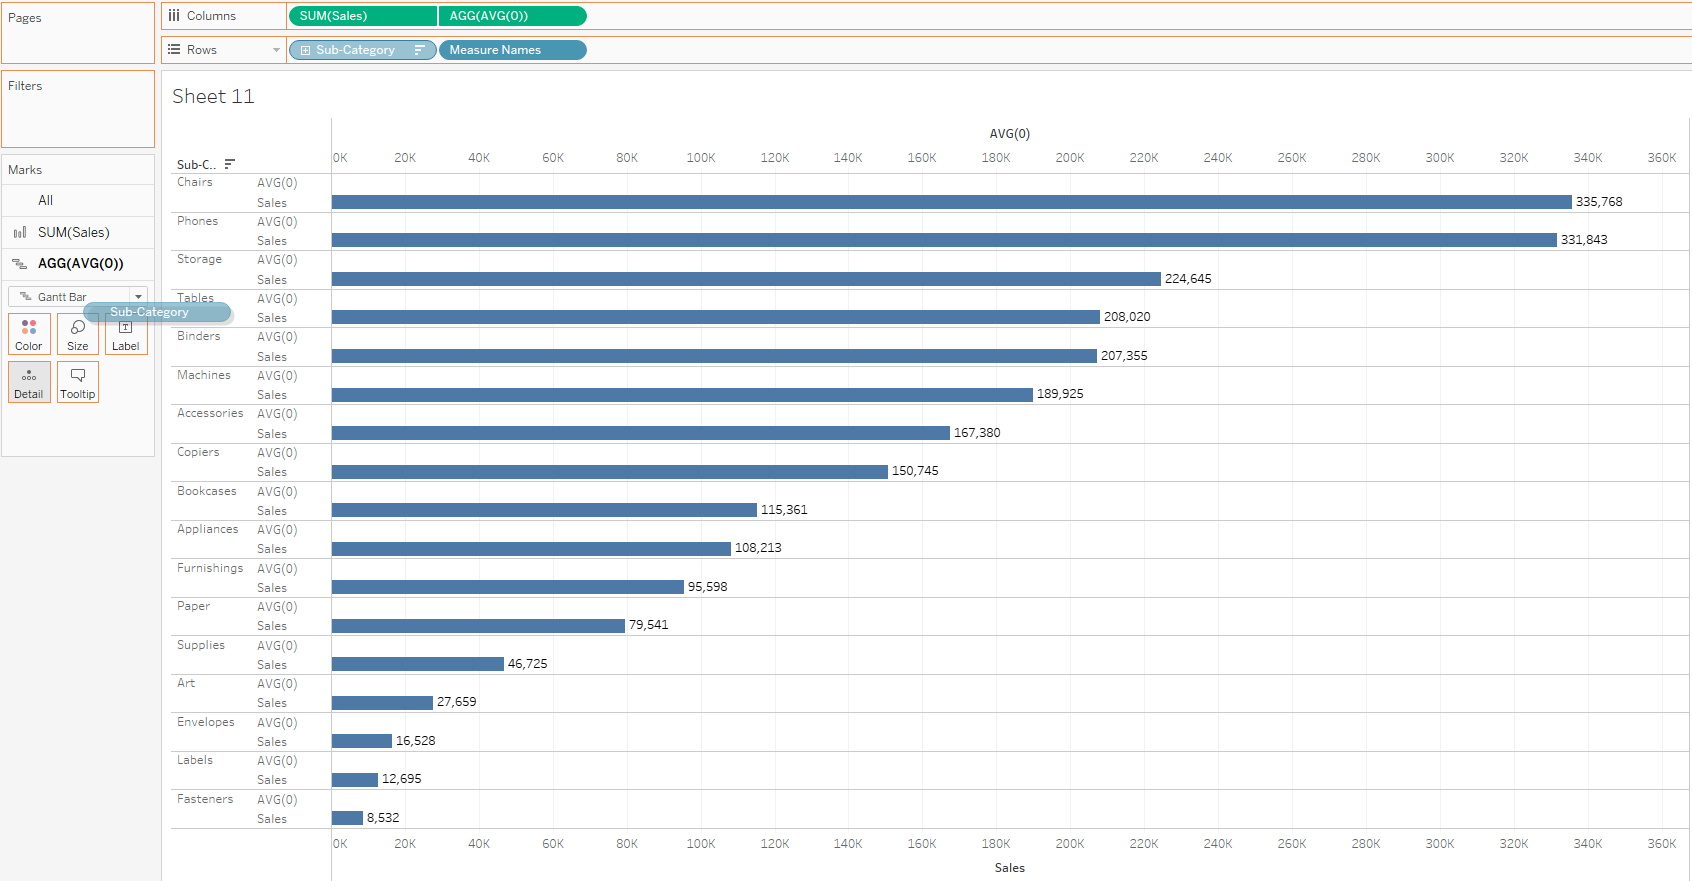
7. Go to the all marks card and drag measure names from colour to the rows shelf.
8. Click on sum of sales marks card, click on labels and show mark labels

8. Click on AVG(0) marks card and reduce opacity and size to 0.

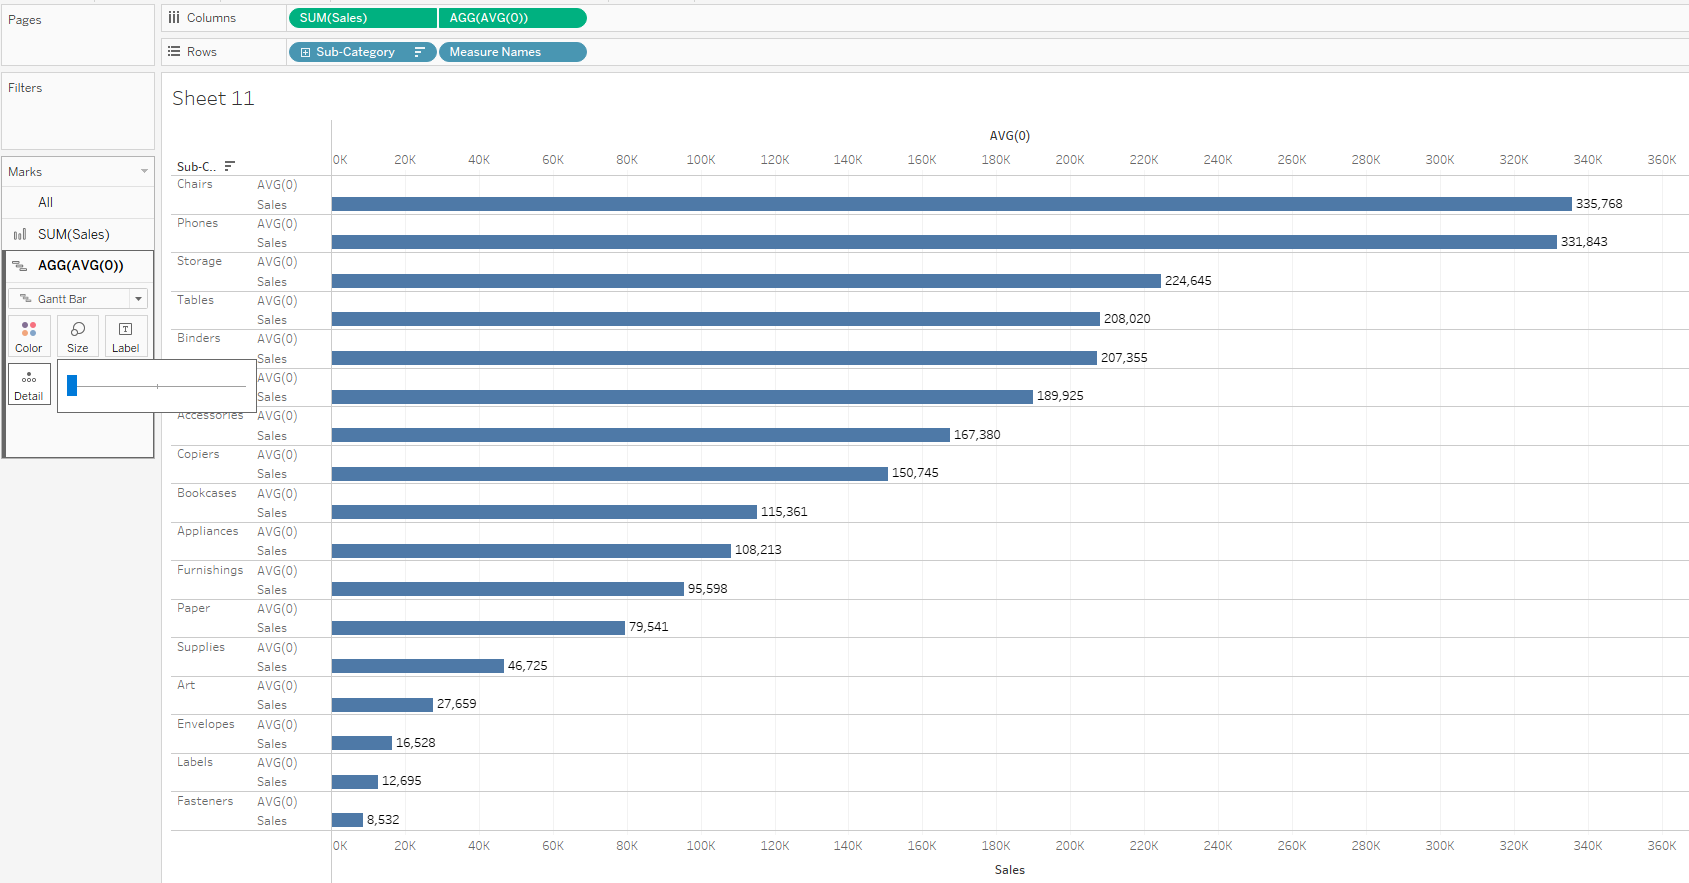
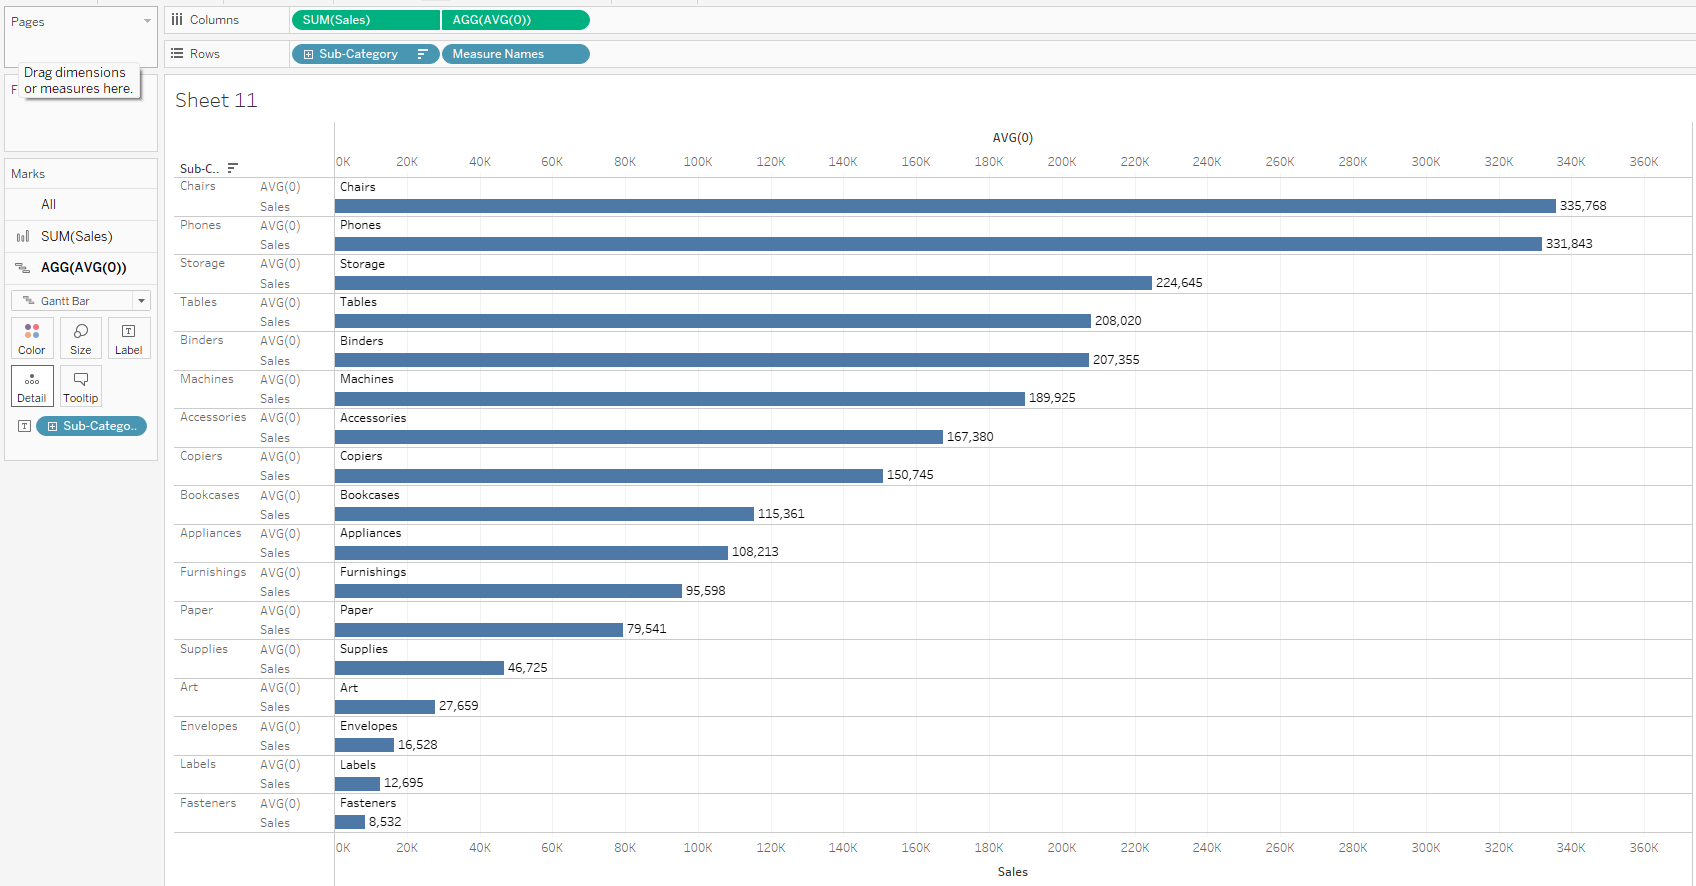
9. With the AVG(0) marks card still opened, control drag sub-categories from rows shelf to label.
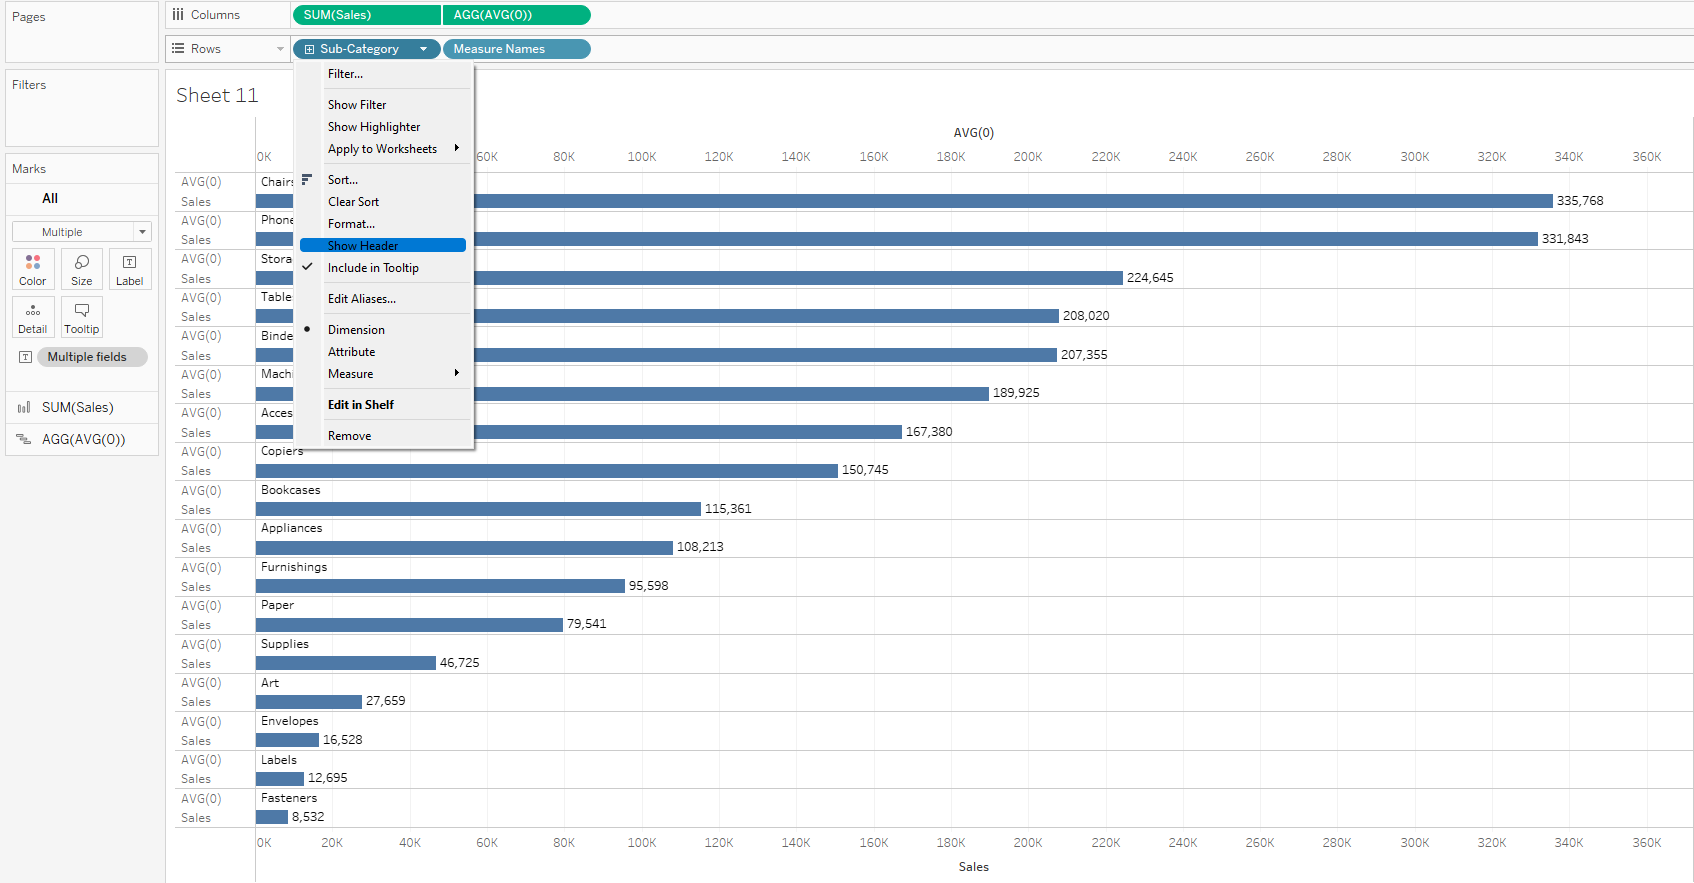
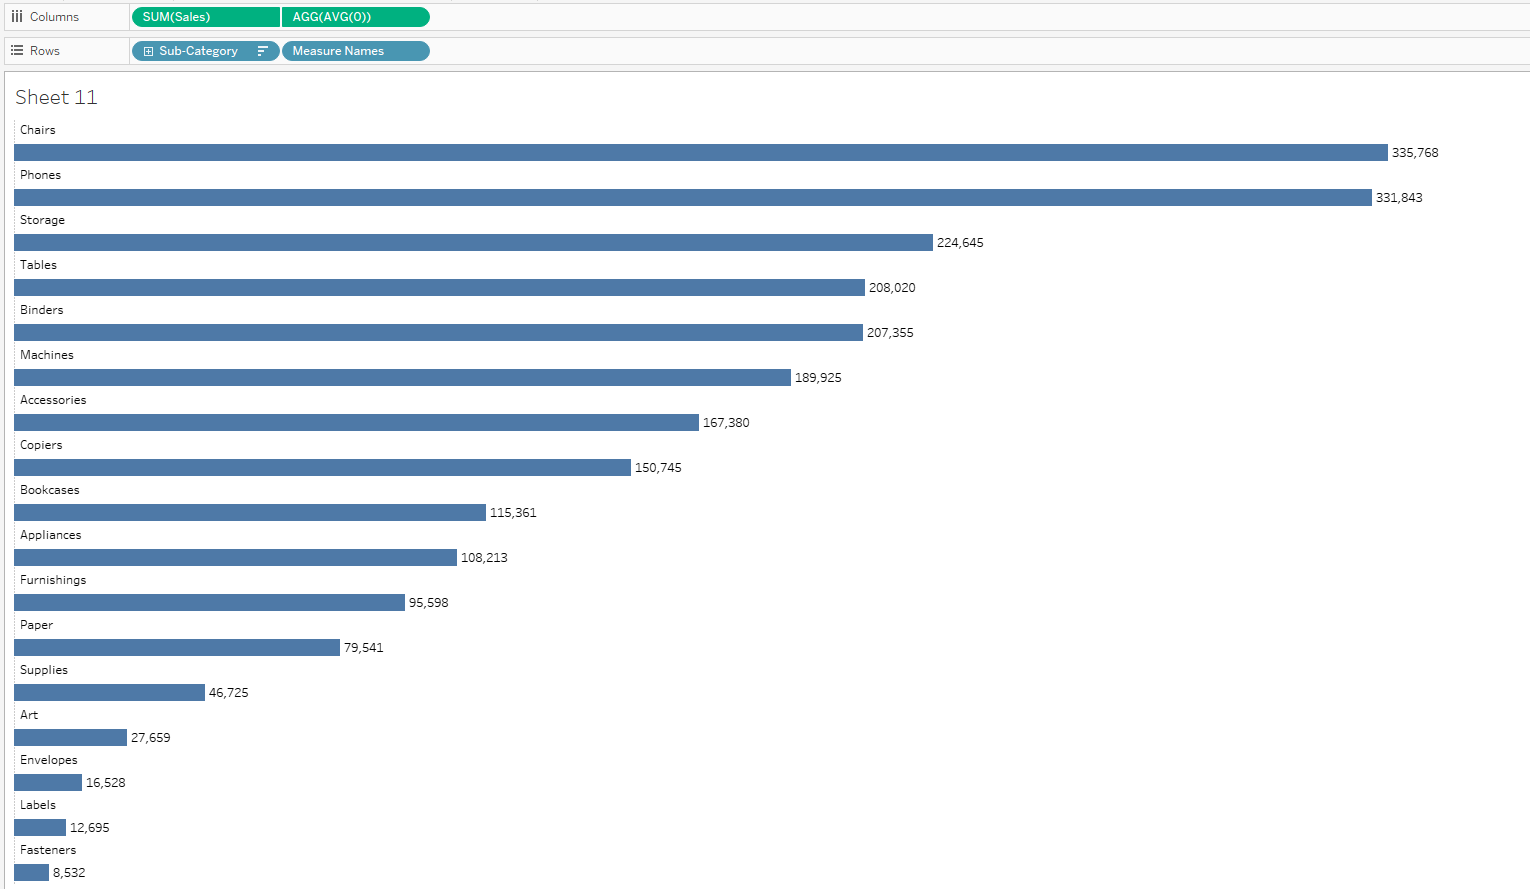
10. Take of the headers of sub-category and Measure names by clicking on their dropdowns and deselecting show header.
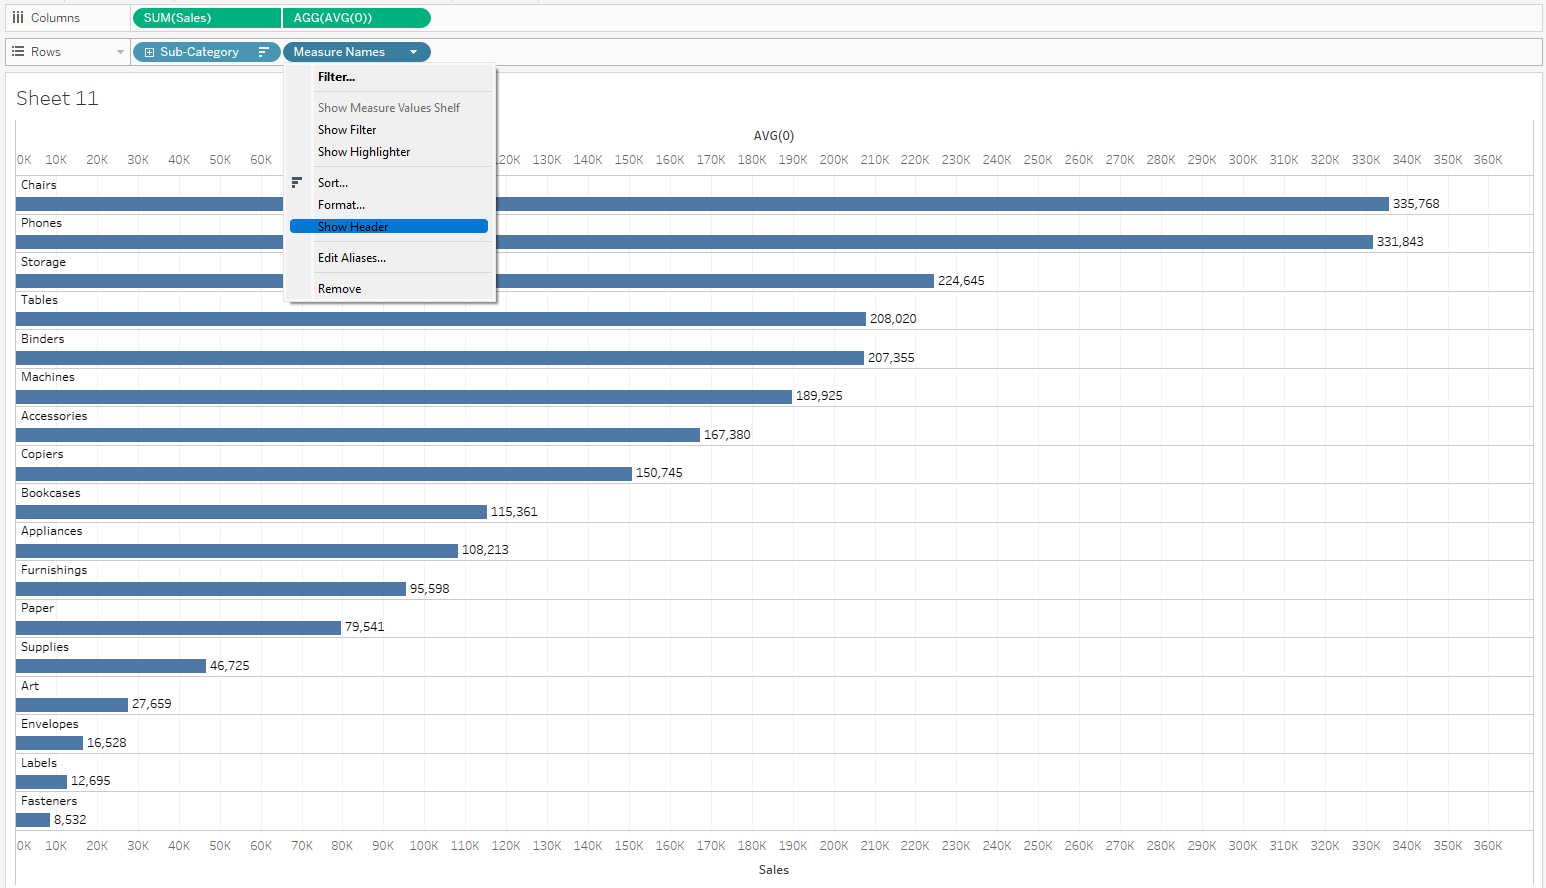
11. Take off both axis by right clicking on the sales axis and deselecting show header.
12. Perform a little formatting on the sheet and you are through with showing labels on top of horizontal bars.
I hope this tip was useful and thanks for reading.