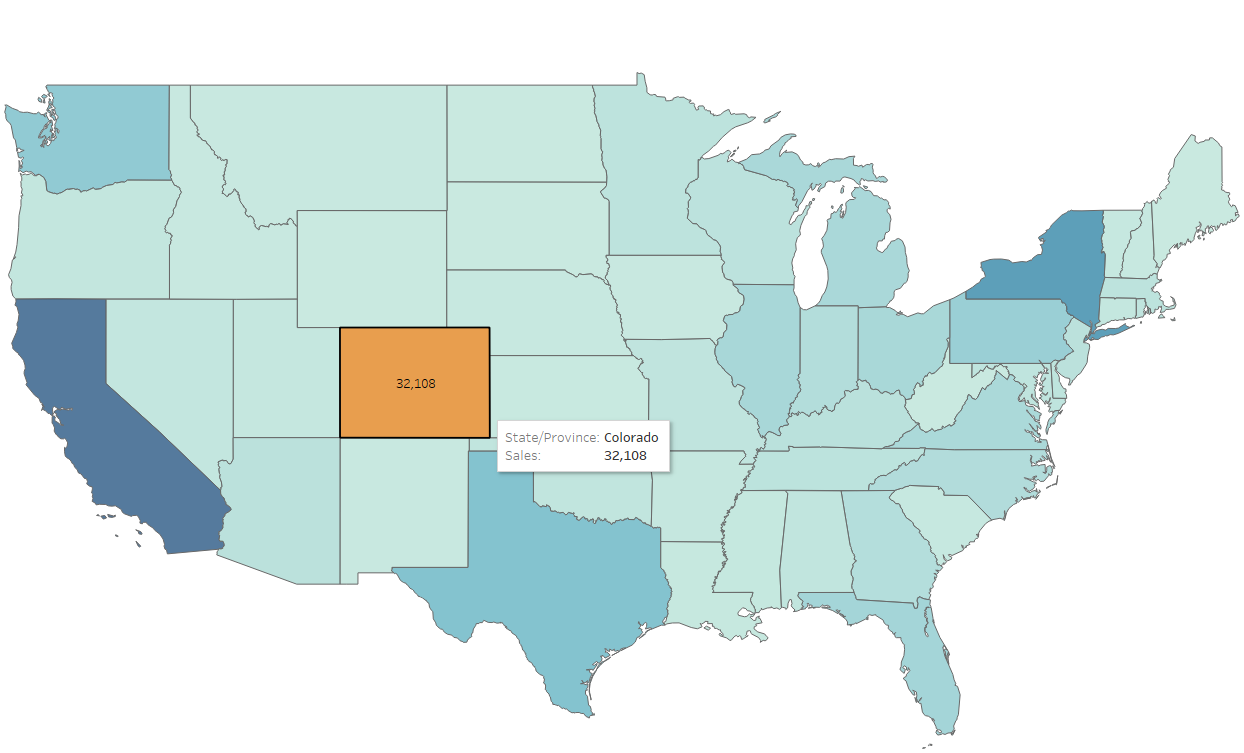
On maps, we usually have a continuous gradient of colours when we place continuous fields on colour. However, for every selected state or region on a map, we can show a discrete colour for it as a highlighter. Lets dig in.
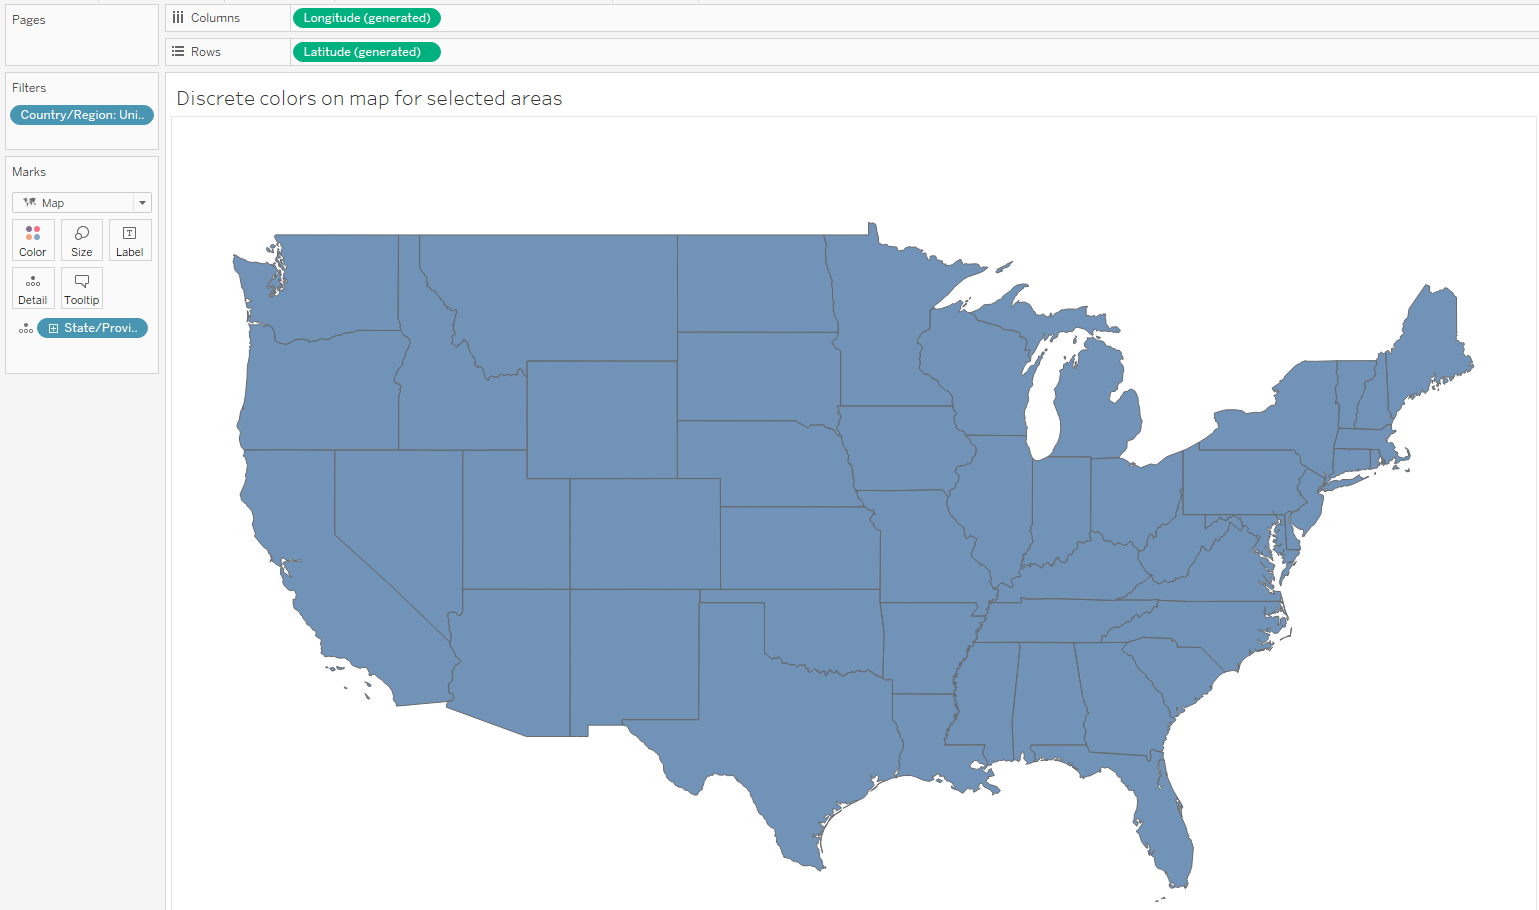
- Using Superstore dataset, create a map by dragging state to details mark and washout the background.
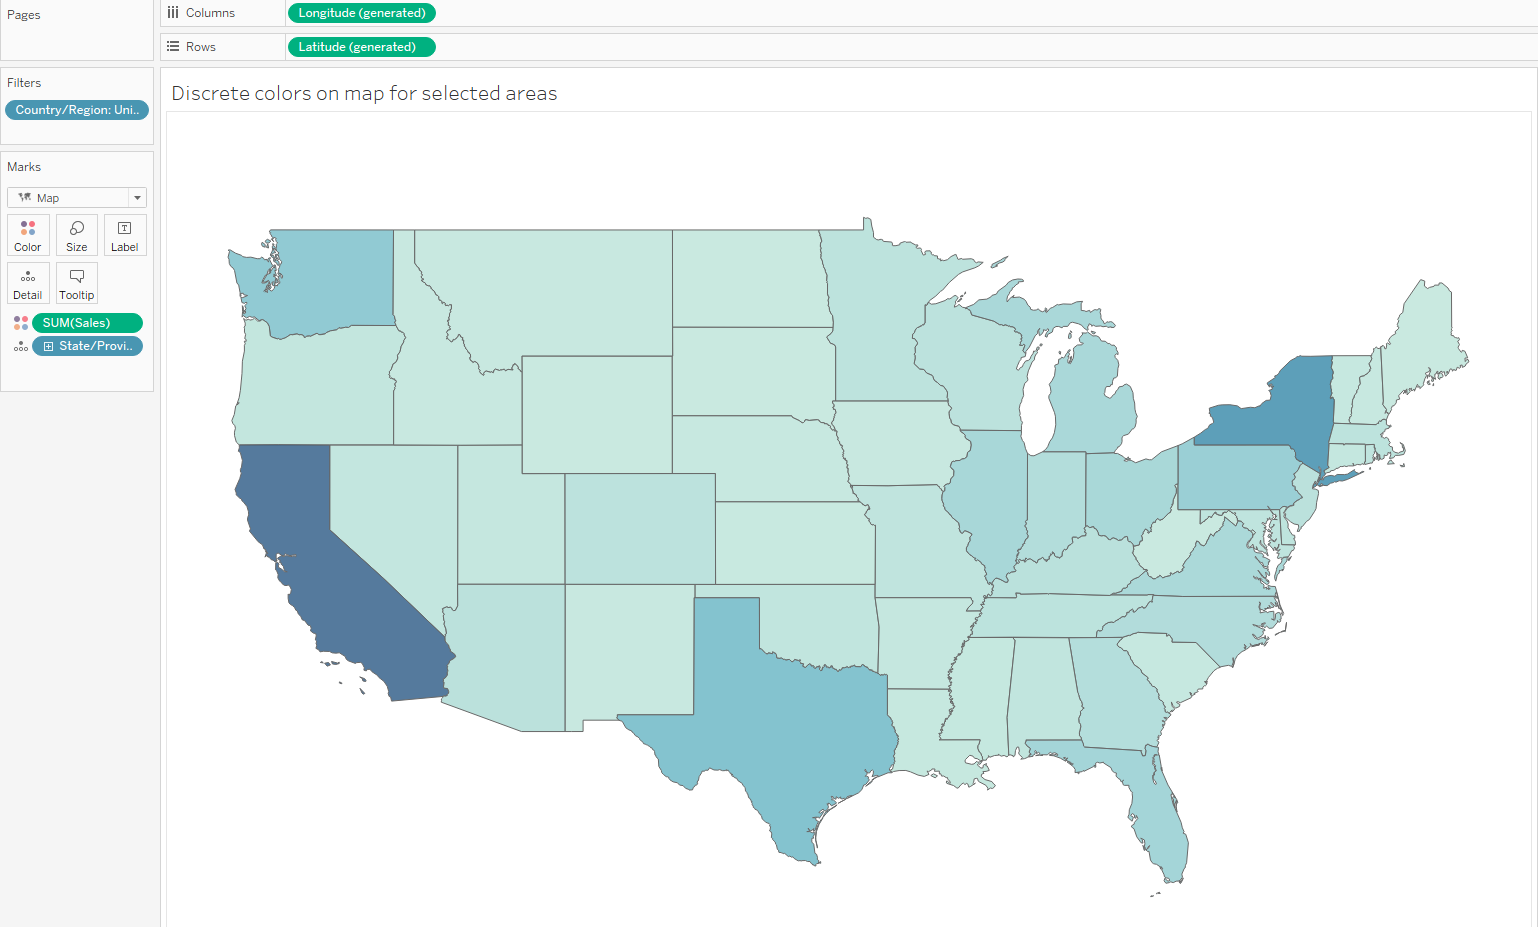
2. Drag Sales unto colour.
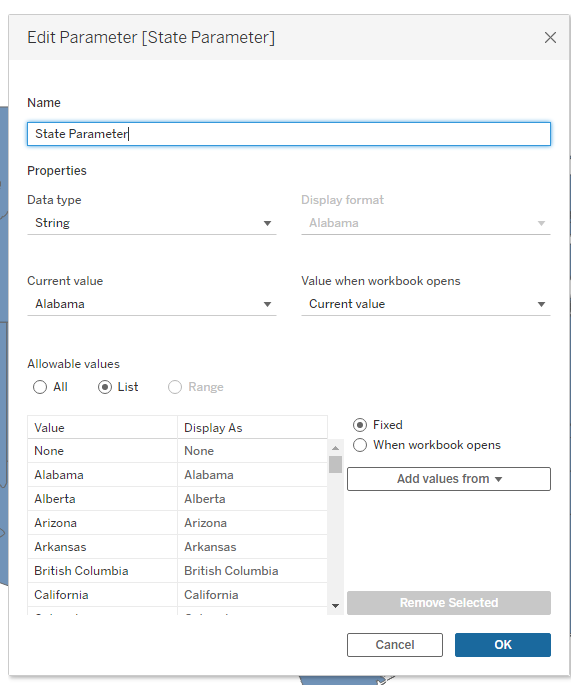
3. Now we want to be able to highlight a state with a colour when we hover over it. To do that lets create a parameter and show it.
4. Lets create a calculated field to be linked with the parameter.

6. Lets create another variant of the map by duplicating the latitude.
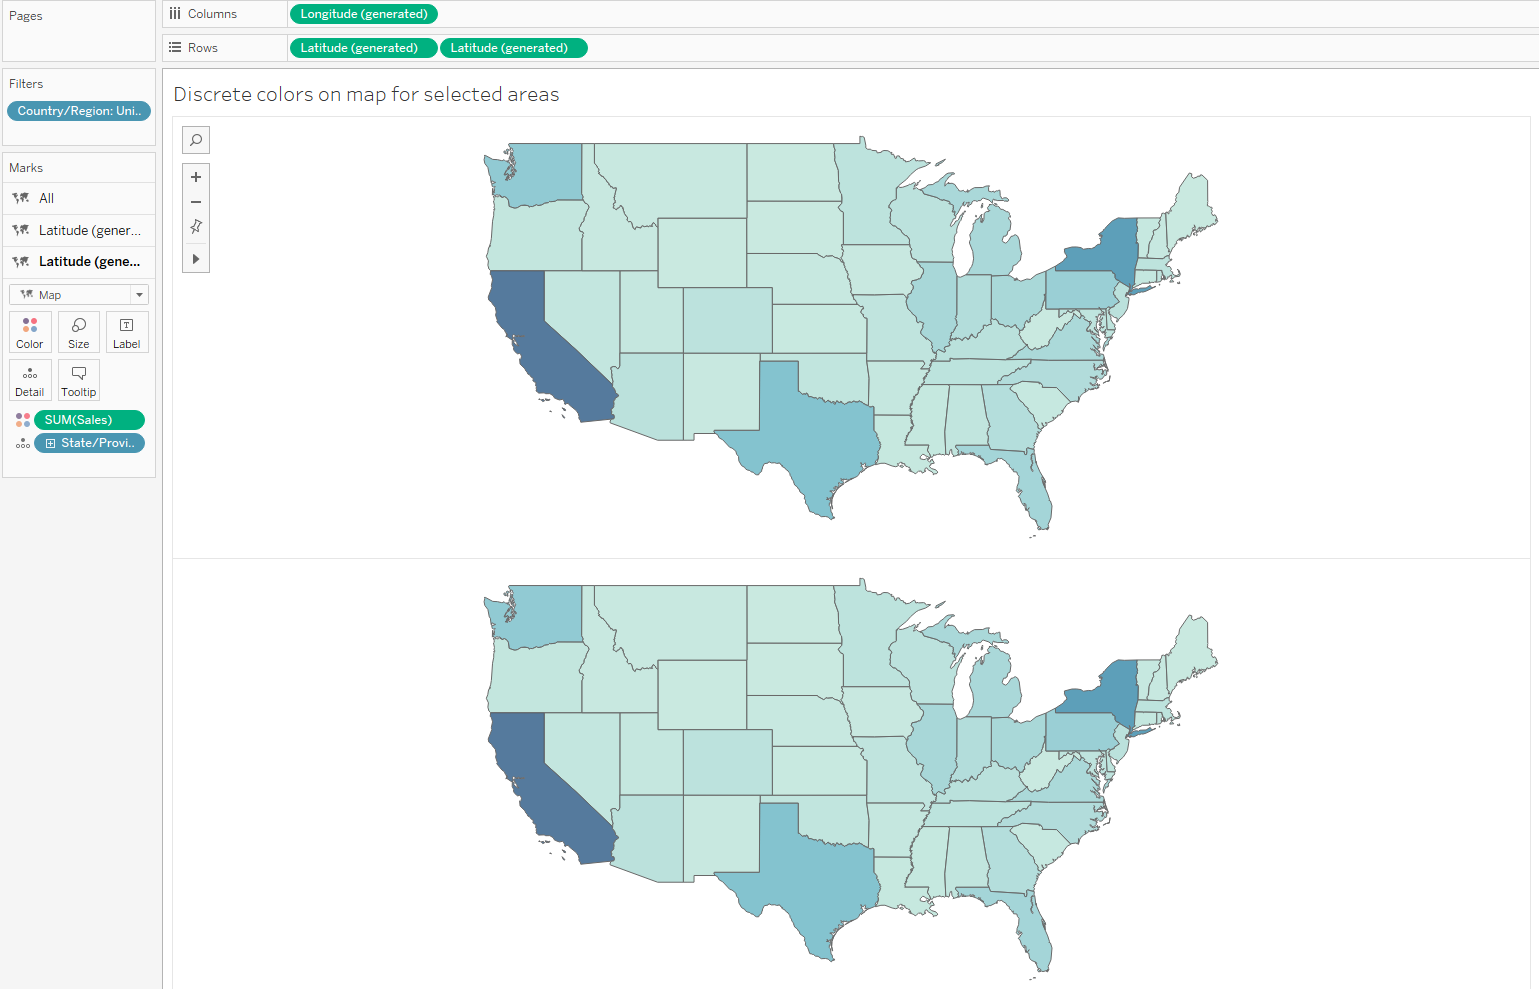
7. On the second map, substitute sales on colour with the calculated field.
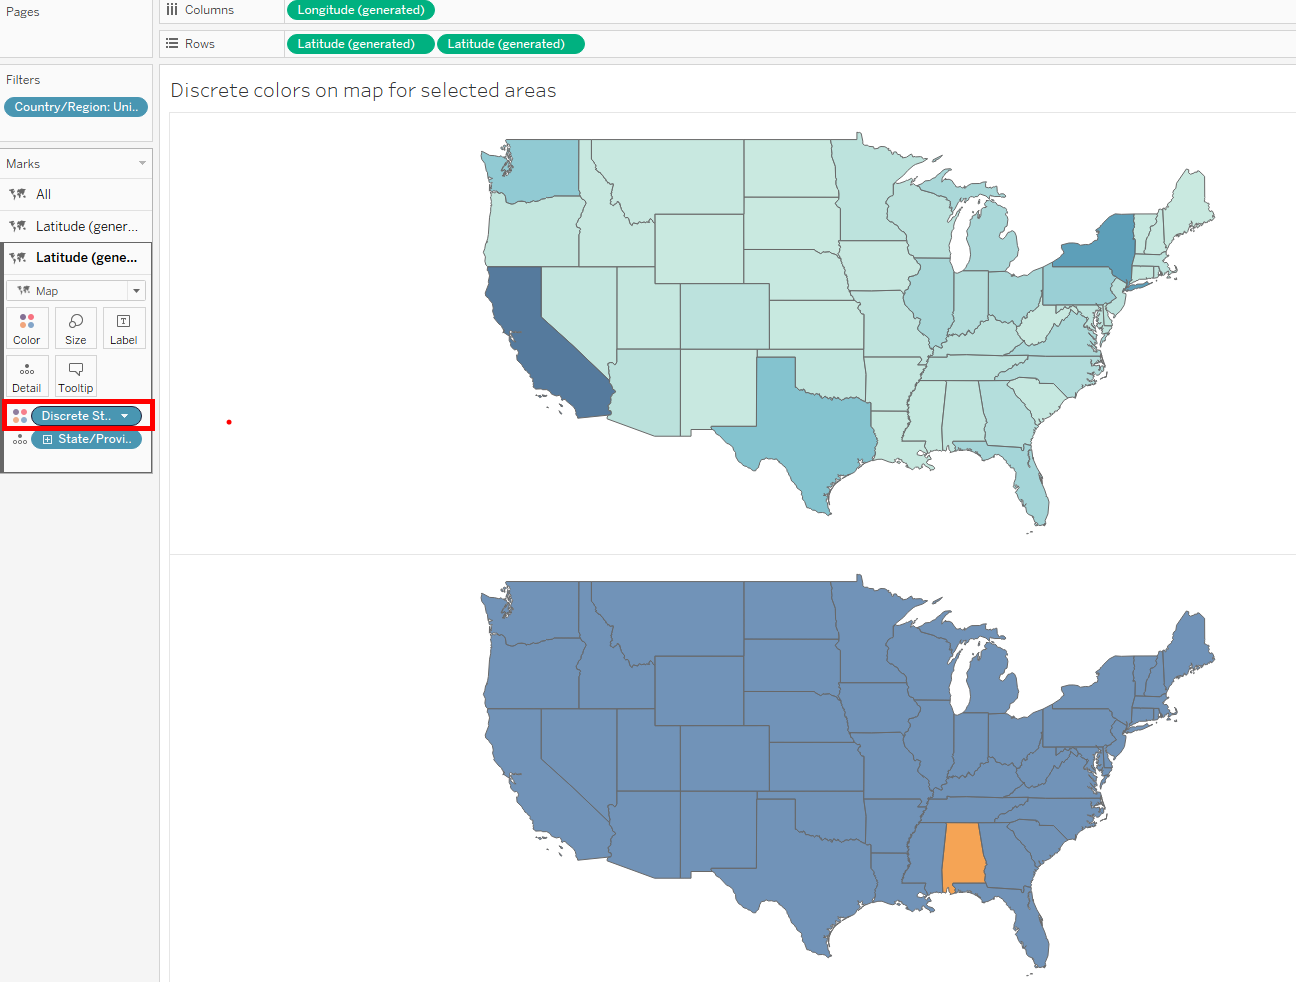
8. Go to the colour legend, right click on false and hide that field.
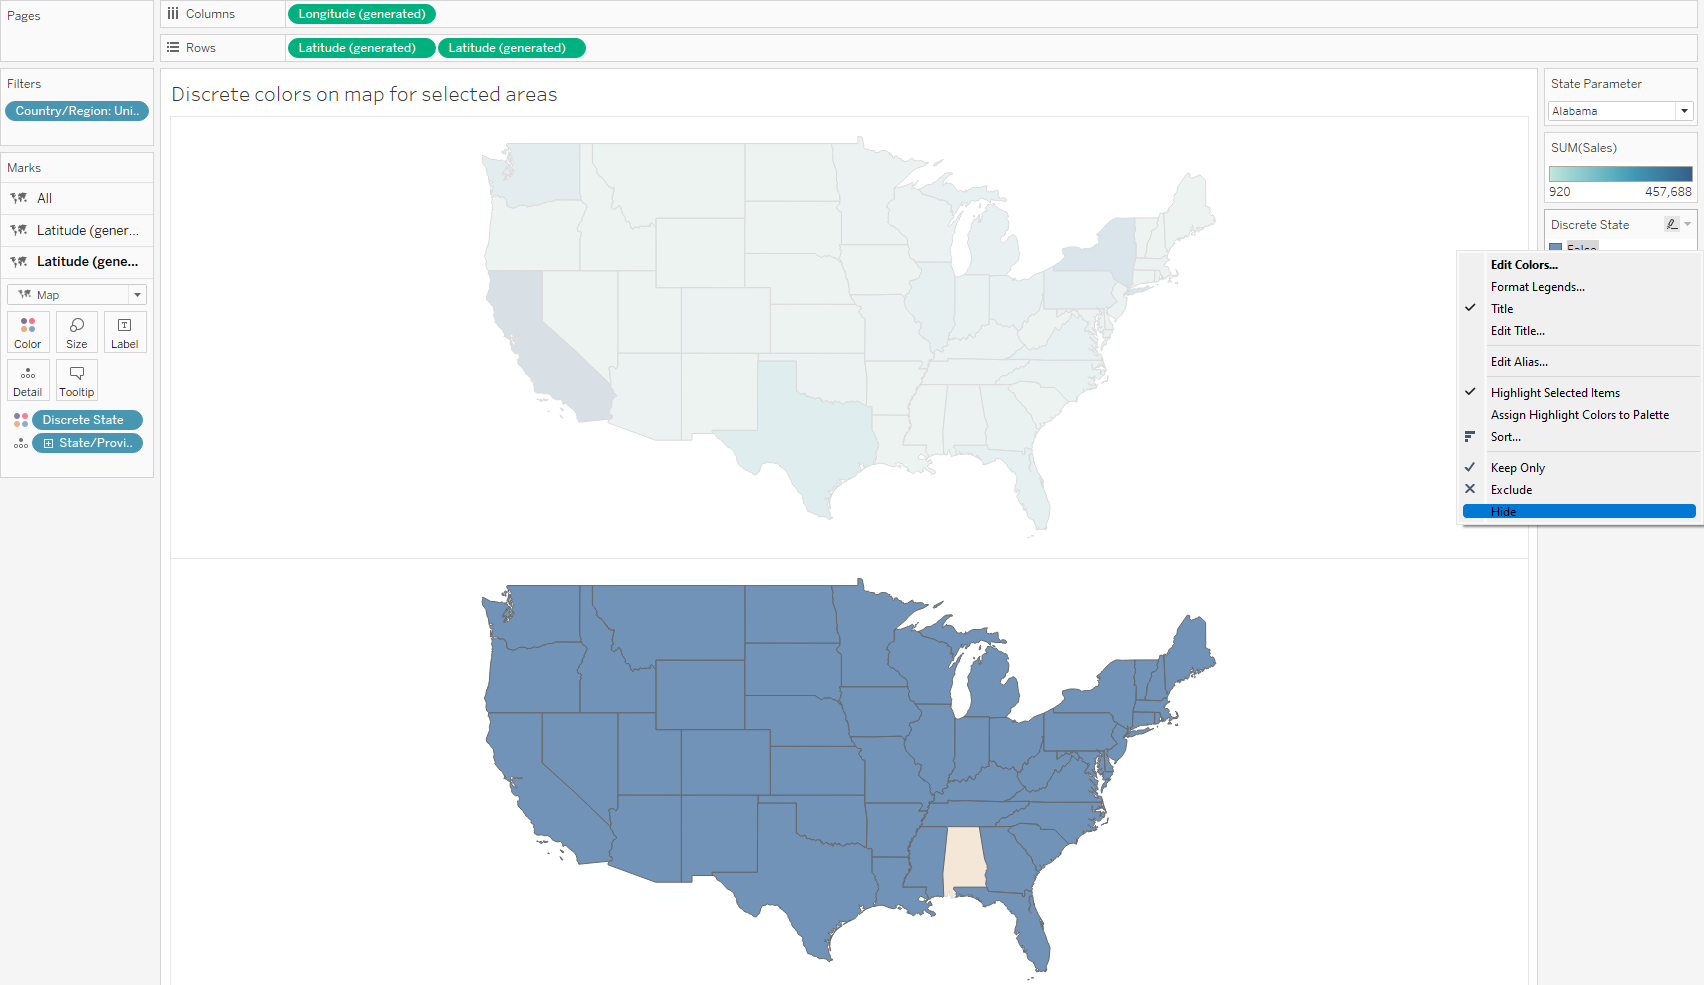
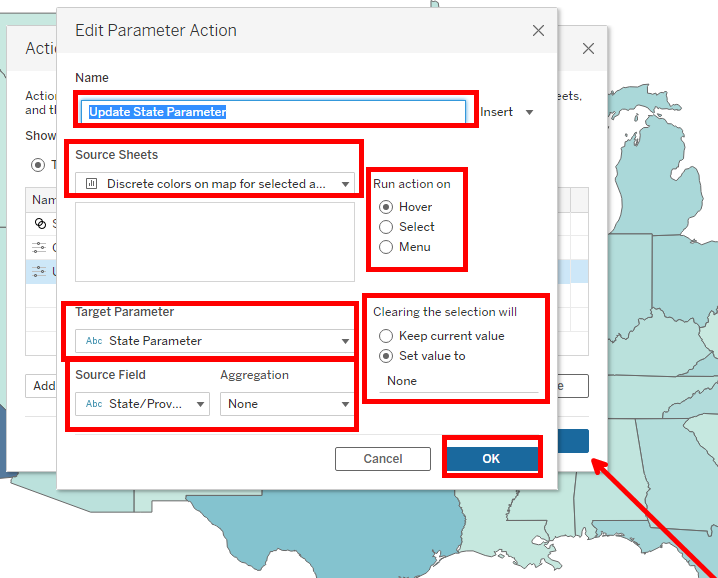
9. Go to the row shelf and create a dual axis on latitude. We can now see that Alabama is highlighted since its selected in the parameter. Since we want a State to be highlighted upon hovering, we will need to create a parameter action for that.
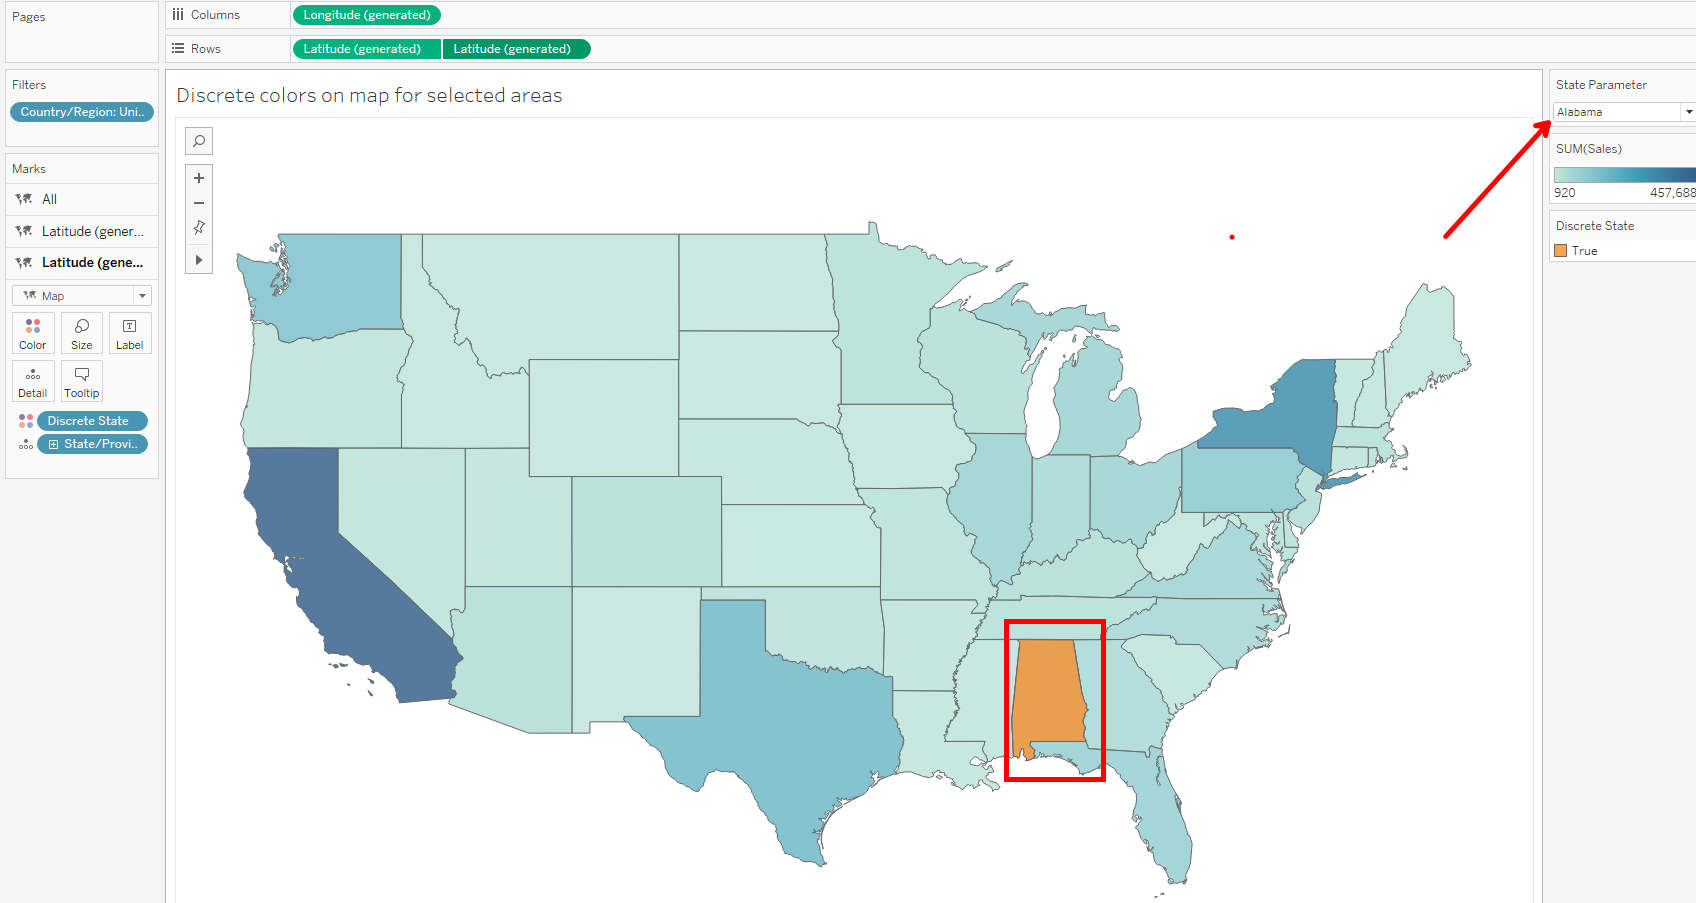
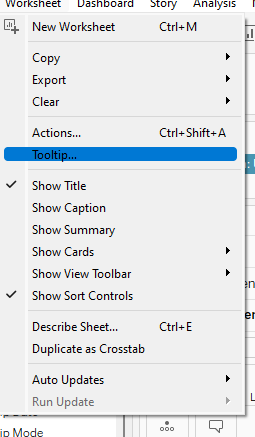
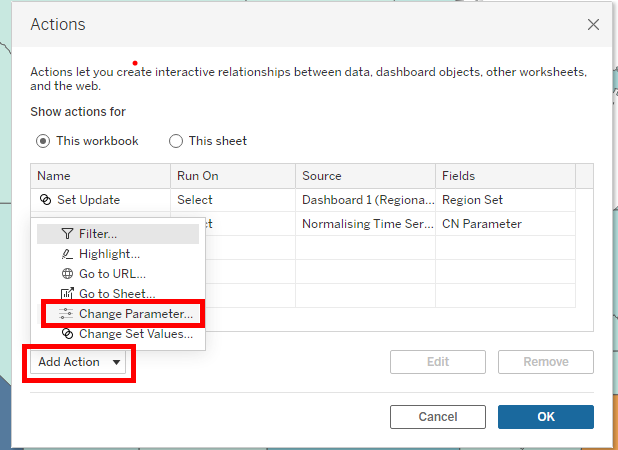
10. Create Parameter action. We can further throw the sales unto label so it also pops up upon hovering.
I hope this tipo helped and thanks for reading.
