Its still Dashboard week and today we were tasked to create a dashboard with a focus on analysis using the Tobacco use supplement data from National Cancer Institute.
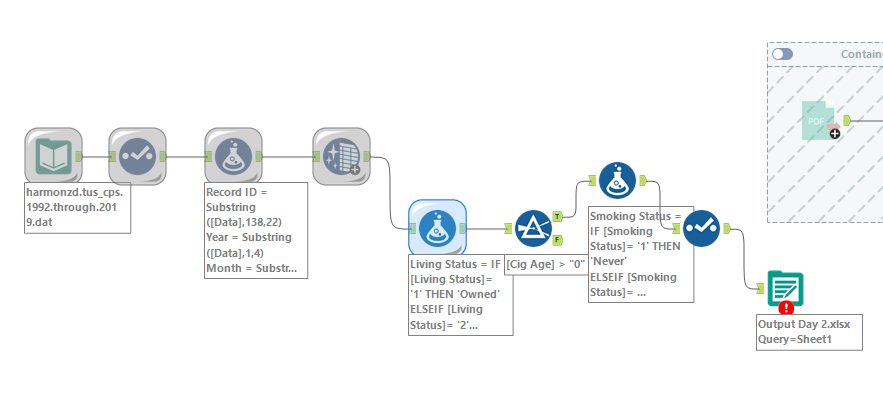
From the onset, I had to peruse the data in order to have an outline of what I actually wanted to analyze. The data set provided was a .dat file which meant I had to bring it into alteryx and do some parsing in order to get the data set extracted.
- I had to bring the data in by dragging and dropping and then read it as a delimited file.
- Secondly I used select tool to alter the header name.
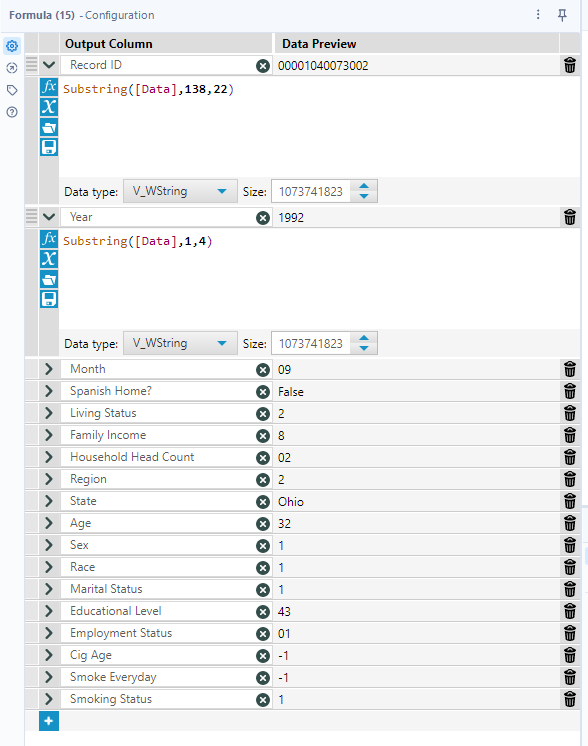
- Then I went on to use the formula tool to extract each column of interest using Substring function. Upon deliberations with my colleagues, we observed chat GPT could also be used to work this out. Check the blog of Lucas Krokatsis .
4. I later did a bit of filtering and cleaning of white spaces. the file was outputed as a .xlsx file which I later moved to Tableau Desktop for dashboarding.
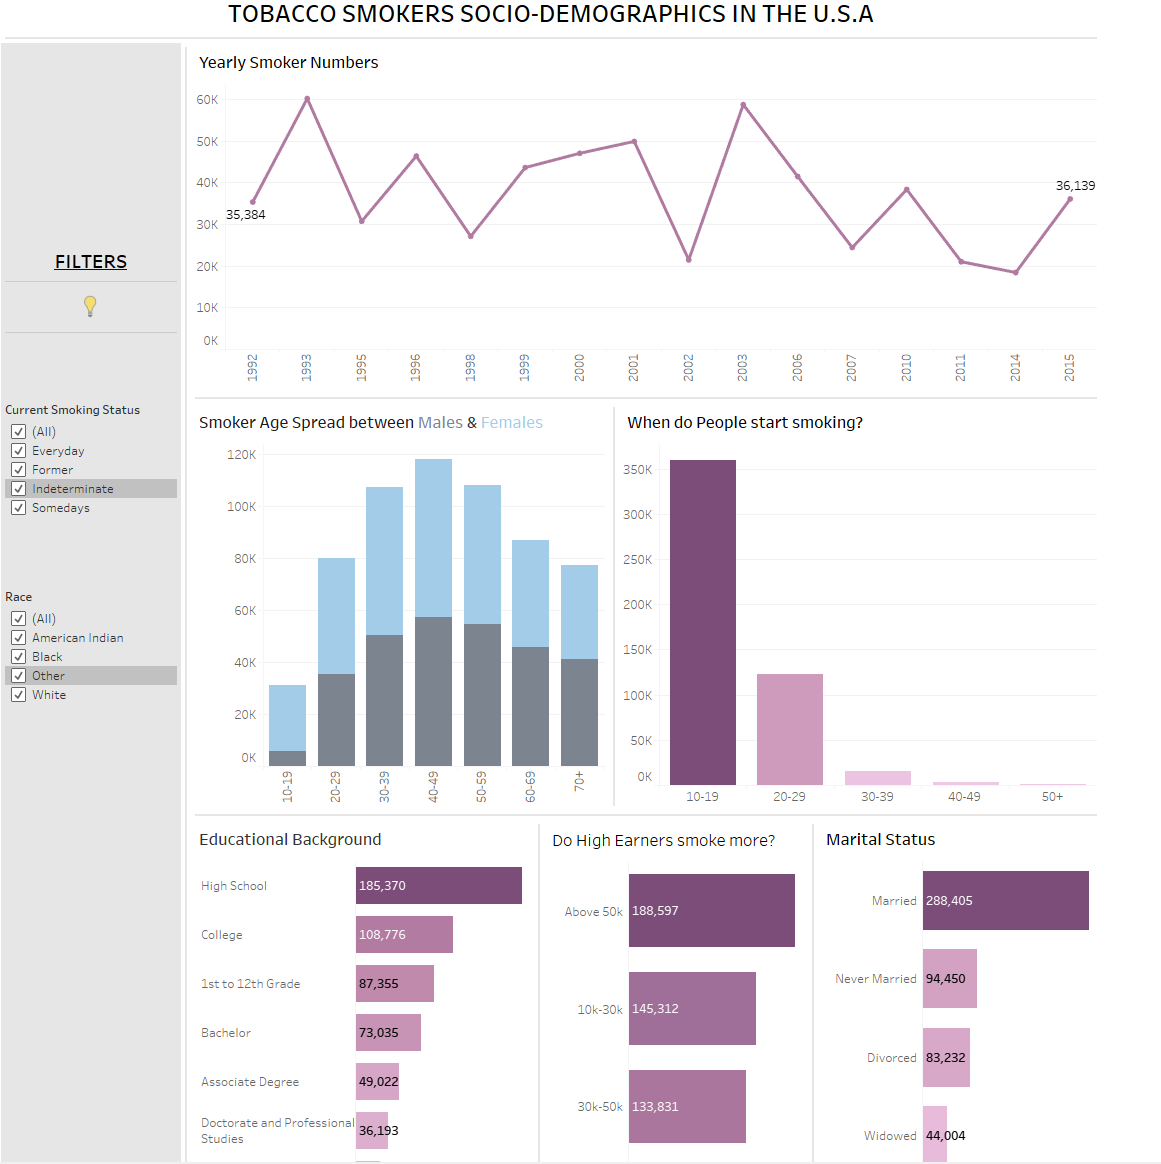
5. On dashboarding I streamlined my question to social demographics of smokers to find out:
a. The yearly spread of smokers
b. The age grouping of smokers and what it meant it terms of gender
c. Which age group was associated with first time smoking
d. What it is with educational levels and smoking, family income and smoking and marital status.
The final dashboard was published to Tableau Public and below is a snapshot: