Today we learnt how to connect points on a map using Spatial tools in Alteryx. This could be useful to create a number of insightful visualizations. To name a few, one could visualize the routes of buses in a city, the routes of airlines across cities (or countries and continents) or to view the patterns of natural phenomena like storms, hurricanes.
The Spatial tab in Alteryx contains tools that allows us to generate spatial data from our data sets and work with it. For example, let’s say I wanted to see the routes of buses in London. I have the data set “Bus stops.csv” as shown below

One can think of the Route as a bus numbers, the Stop_Name are the stops that each bus covers, the Sequence gives the order in which this stops are covered, then we have the Longitude and Latitude of each stop. Let’s go through the steps I used to create these bus routes or lines in Alteryx.

1. I used the Select tool to check that the data types are correct. I also made sure that Sequence is a numeric data type as this will be important for later.
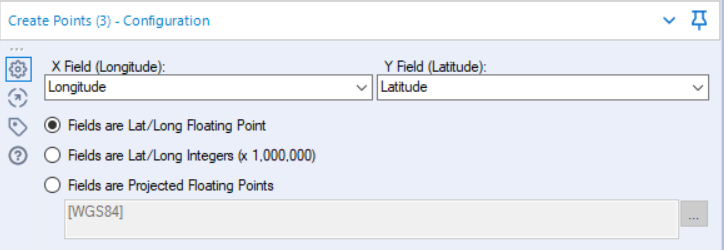
2. The Create Points tool allows to generate a Point type Spatial object from the Longitude and Latitude fields.

These points can then be used downstream for mapping and spatial calculations.
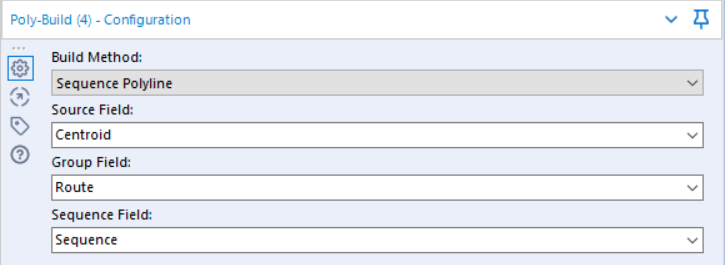
3. The Poly-Build tool uses the spatial object to create a line between the points of each stop following a given path. From the Build Method options one can also choose to draw a sequence polygon or a convex hull polygon connecting the points.

To create a sequencial line or polygon a "Sequence Field" must be specified. Remember I changed the data type the Sequence to numeric, this is because I wanted the data to be read in a numeric order and not alphabetically. It is also important for your data to be downstream because this spatial tools works down rows and not across different colums. At this point the bus routes have been created and a browse tool can be used to view them. However, I did one additional step to further explore the use of spatial tools.
4. The Spatial Info tool allows to extract more info about spatial objects. In this case I wanted to know the length in kilometers of each of these bus lines and this was outputed to a new column. There are many other options to choose in the configuration window.
5. The spatial objects created in tableau can viewed on a map by using a Browse tool.

Here is the map illustrating the different routes of buses in London. The pink line is simply Route 1 that has been highlighted. The output file can also be used in Tableau to do further visualizations. These lines can also be created in Tableau as shown by my fellow Data Schooler, Tanya Fischer, in her blogpost: Visualizing a Route in Tableau.
