


In our last post, we learned how to get hitting statistics for a single player using the MLB Stats API with Python. If you missed it, you can find that post here: https://www.thedataschool.co.uk/martin-regan/baseball-analytics-in-python/
This week, we’re going to look at how to see the league leaders in a chosen statistic.
You can choose any stat, but we'll look at OPS. OPS combines a hitter’s ability to get on base with their power hitting, and it’s a great starting point if you’re deciding between players for your fantasy roster. Rather than typing in names one by one, we’ll ask the API for the top hitters in MLB based on this stat and turn the result into a simple table.
Here’s the code you can run in your Jupyter notebook:
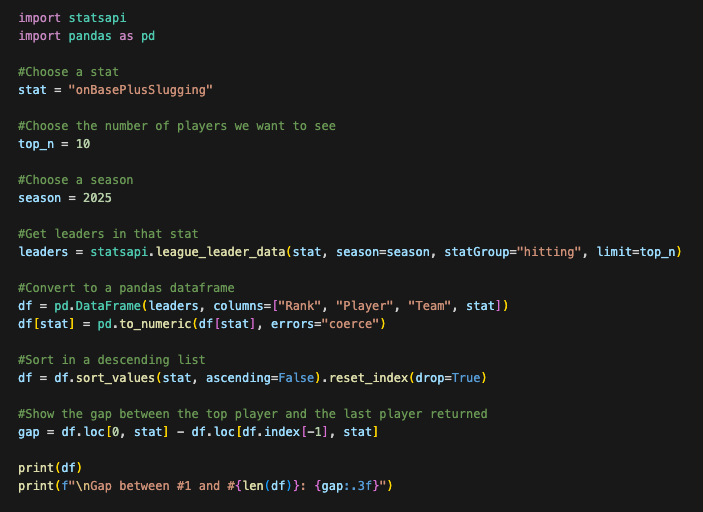
Here's what is happening in our code:
Choose the stat
We choose the stat we want to see the top players for, in this case, onBasePlusSlugging (OPS). You can replace this with other stats like homeRuns, stolenBases, or battingAverage to explore different fantasy categories (see below for a list of stats you might like to input here).
Set the number of players and choose a season
We set the number of players we want to see in a list using top_n, and we specify a season. As the 2026 season hasn't started yet, we'll choose 2025.
Get the top performers for that stat
Then use the statsapi.league_leader_data() function to get the top hitters in that stat for the chosen season. The function returns a simple list containing each player’s rank, name, team, and the chosen stat.
Make a dataframe
Next, we convert that list into a pandas dataframe so we can work with it more easily. We also convert the stat column to numeric values so we can perform calculations.
Sort the output
We sort the dataframe in descending order so the highest values appear at the top of the table.
Find the gap between the first and last player in the output
Finally, we calculate the gap between the first and last players in our dataframe. As the top players are too expensive for our fantasy team, we can use this gap to see which cheaper players are not too far behind the league leading guys.
Here’s an example of what the output might look like:
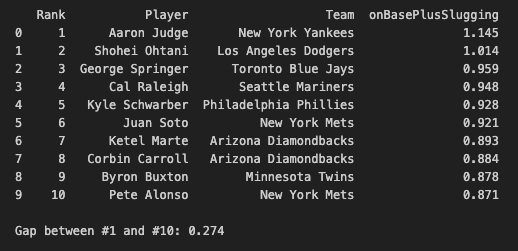
By using these lists, we can find affordable players that perform well in the areas we need for our fantasy team. Next time, we'll delve further into the dataframes we build with this code.
Here are the hitting statistics you can enter into the "stat" variable we have created today. They are case-sensitive and need to be enclosed in quotation marks. Just like last week, you can find official stat definitions here: https://www.mlb.com/glossary/standard-stats
Power
- homeRuns
- totalBases
- extraBaseHits
- sluggingPercentage
Average / On-Base
- battingAverage
- onBasePercentage
- onBasePlusSlugging
Run Production
- runsBattedIn
- runs
Speed
- stolenBases
- stolenBasePercentage
Plate Discipline
- walks
- strikeouts
- strikeoutWalkRatio