


Data is everywhere.
Whether you are shopping online, checking the weather, tracking your fitness goals, or watching sports, you interact with data every day.
Behind every product recommendation, weather forecast, sports visualization, and business dashboard is a continuous process of collecting, analyzing, and using data to answer questions and support decisions. While the technology behind these experiences can seem incredibly sophisticated, the core journey is surprisingly simple.
At a high level, nearly every data journey follows the same three-step process. Data is collected from one or more sources, analyzed to uncover meaningful insights, and ultimately used to support decisions. As new questions arise, the cycle begins again.
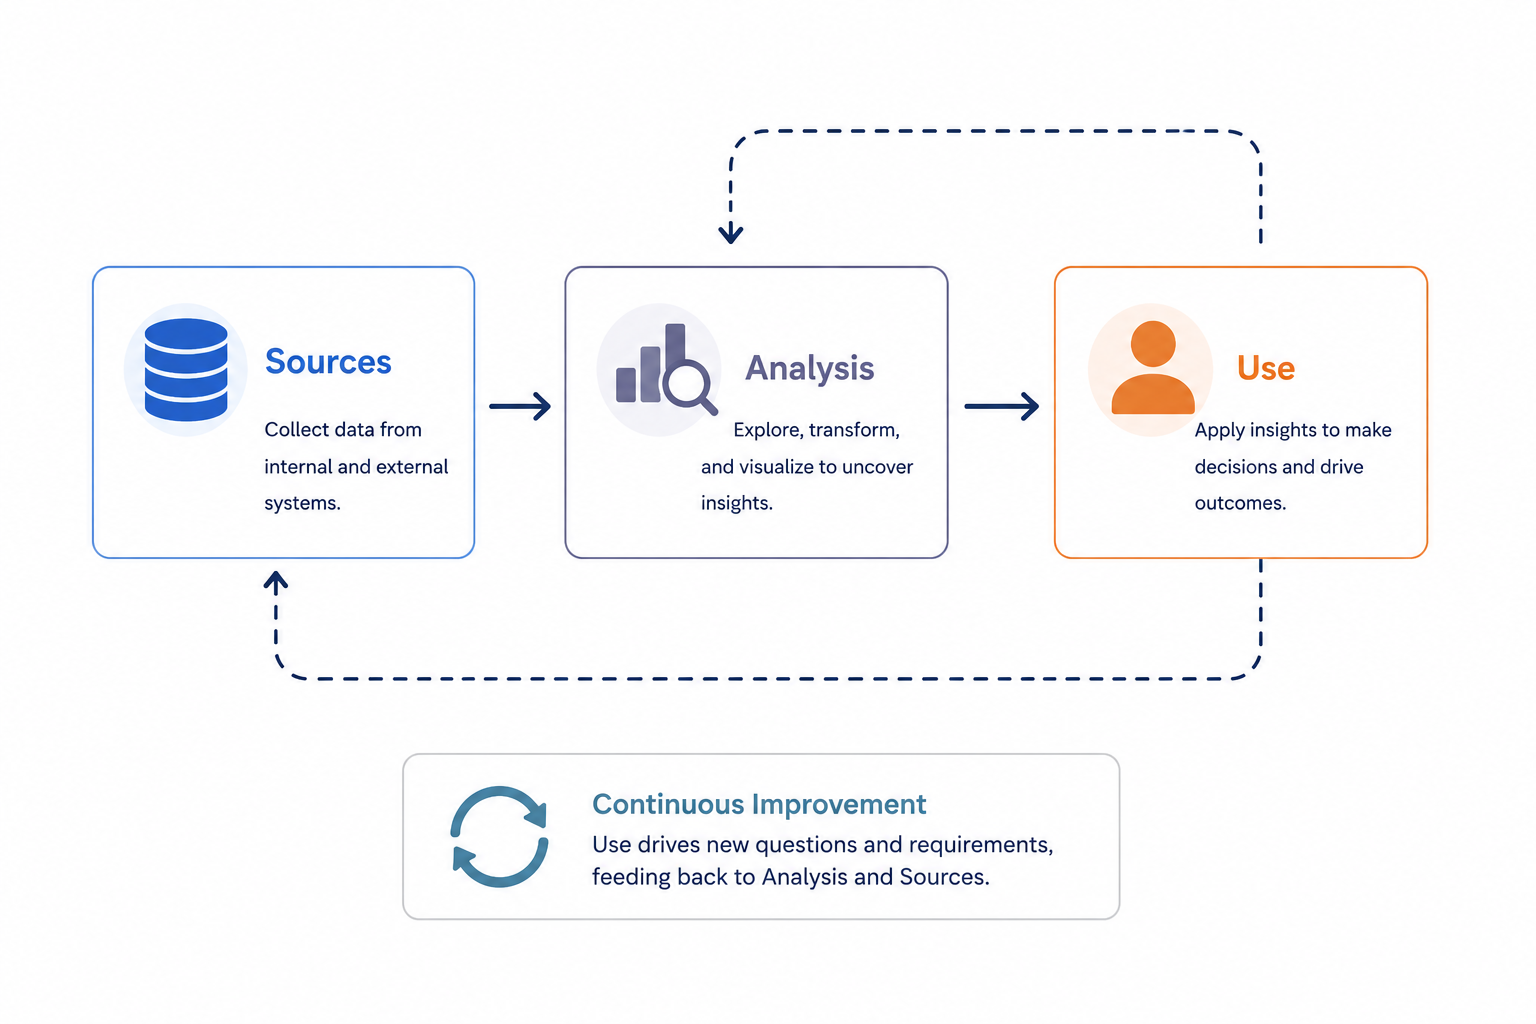
Think of an online retailer. Every customer purchase generates raw data. That data is analyzed to uncover patterns, and the resulting insights are used to support better business decisions. Those decisions often lead to new questions, starting the process all over again.
Although this may look like a straightforward path, the journey is inherently iterative. Once insights are put into action, new questions naturally emerge. Stakeholders may request additional metrics, another visualization, or entirely new data to answer a different question. Those requests feed back into the process, creating an ongoing cycle of improvement rather than a one-time workflow.
Every answer creates an opportunity to ask a better question.
What Is Data?
Before we explore analytics and the ways data is used, it is important to first understand what data is.
One definition I particularly like comes from Data Curious (2023):
"Data is the facts or numbers collected from observations for the purpose of understanding a particular subject better."
Although this definition seems simple, it has three important ideas:
Facts
Facts are the individual pieces of information that have been collected.
Examples include:
- A customer purchased a product
- A package shipped yesterday
- Today’s temperature is 82°F
- A patient checked into a hospital
By themselves, these facts may not tell us very much. They are individual pieces of information waiting to be interpreted.
Observations
Data does not appear on its own. It comes from observing something happening in the real world.
Examples include:
- A customer makes a purchase
- A user clicks on a website
- A shipment leaves a warehouse
- A sensor records a temperature reading
- A patient checks into a hospital
As these observations accumulate, they begin to reveal patterns and tell a larger story.
Understanding
Collecting data is not the ultimate goal. Understanding is.
Examples of questions organizations want to answer include:
- Which products are selling the best?
- Why are customers leaving?
- Which marketing campaigns are the most effective?
- Where are operational bottlenecks occurring?
Without a question to answer, data is simply information being stored. Its value comes from the understanding it can help create.
How Is Data Used?
Data becomes valuable when it is analyzed to answer questions and support decisions.
Imagine an online retailer tracking thousands of purchases each day. Individually, each purchase represents a single observation. Together, those observations can help answer questions such as:
- Which products are selling the fastest?
- Which regions generate the most revenue?
- Are customer buying habits changing over time?
By analyzing these patterns, organizations can make informed decisions rather than relying solely on assumptions. A retailer might adjust inventory levels, refine its marketing strategy, or identify new opportunities based on what the data reveals.
Every meaningful insight, business decision, and data-driven innovation begins with collecting meaningful observations and transforming them into understanding.
Looking Ahead
In this first installment of The Data Journey, we explored what data is, where it comes from, and how organizations use it. We also introduced the simple lifecycle connecting Sources, Analysis, and Use, showing how observations become insights and how decisions lead to new questions.
Whether it is a weather forecast, an online purchase, or a business dashboard, every data-driven experience begins with observations that are transformed into meaningful insights. Once those insights are put into action, the journey begins again.
Understanding what data is naturally leads to another question:
Where does all of this data actually live?
In the next installment of The Data Journey, we'll follow the next step in the lifecycle by exploring where data actually lives. From traditional databases to modern data warehouses, data lakes, and lakehouses, we'll examine how organizations store and organize data before it can be analyzed.