Tableau's true functional beauty comes into play when we bring some helpful tools into play.
A dynamic reference line is a reference line that changes which value it rests on without the user having to input a line from the analytics pane. For example:

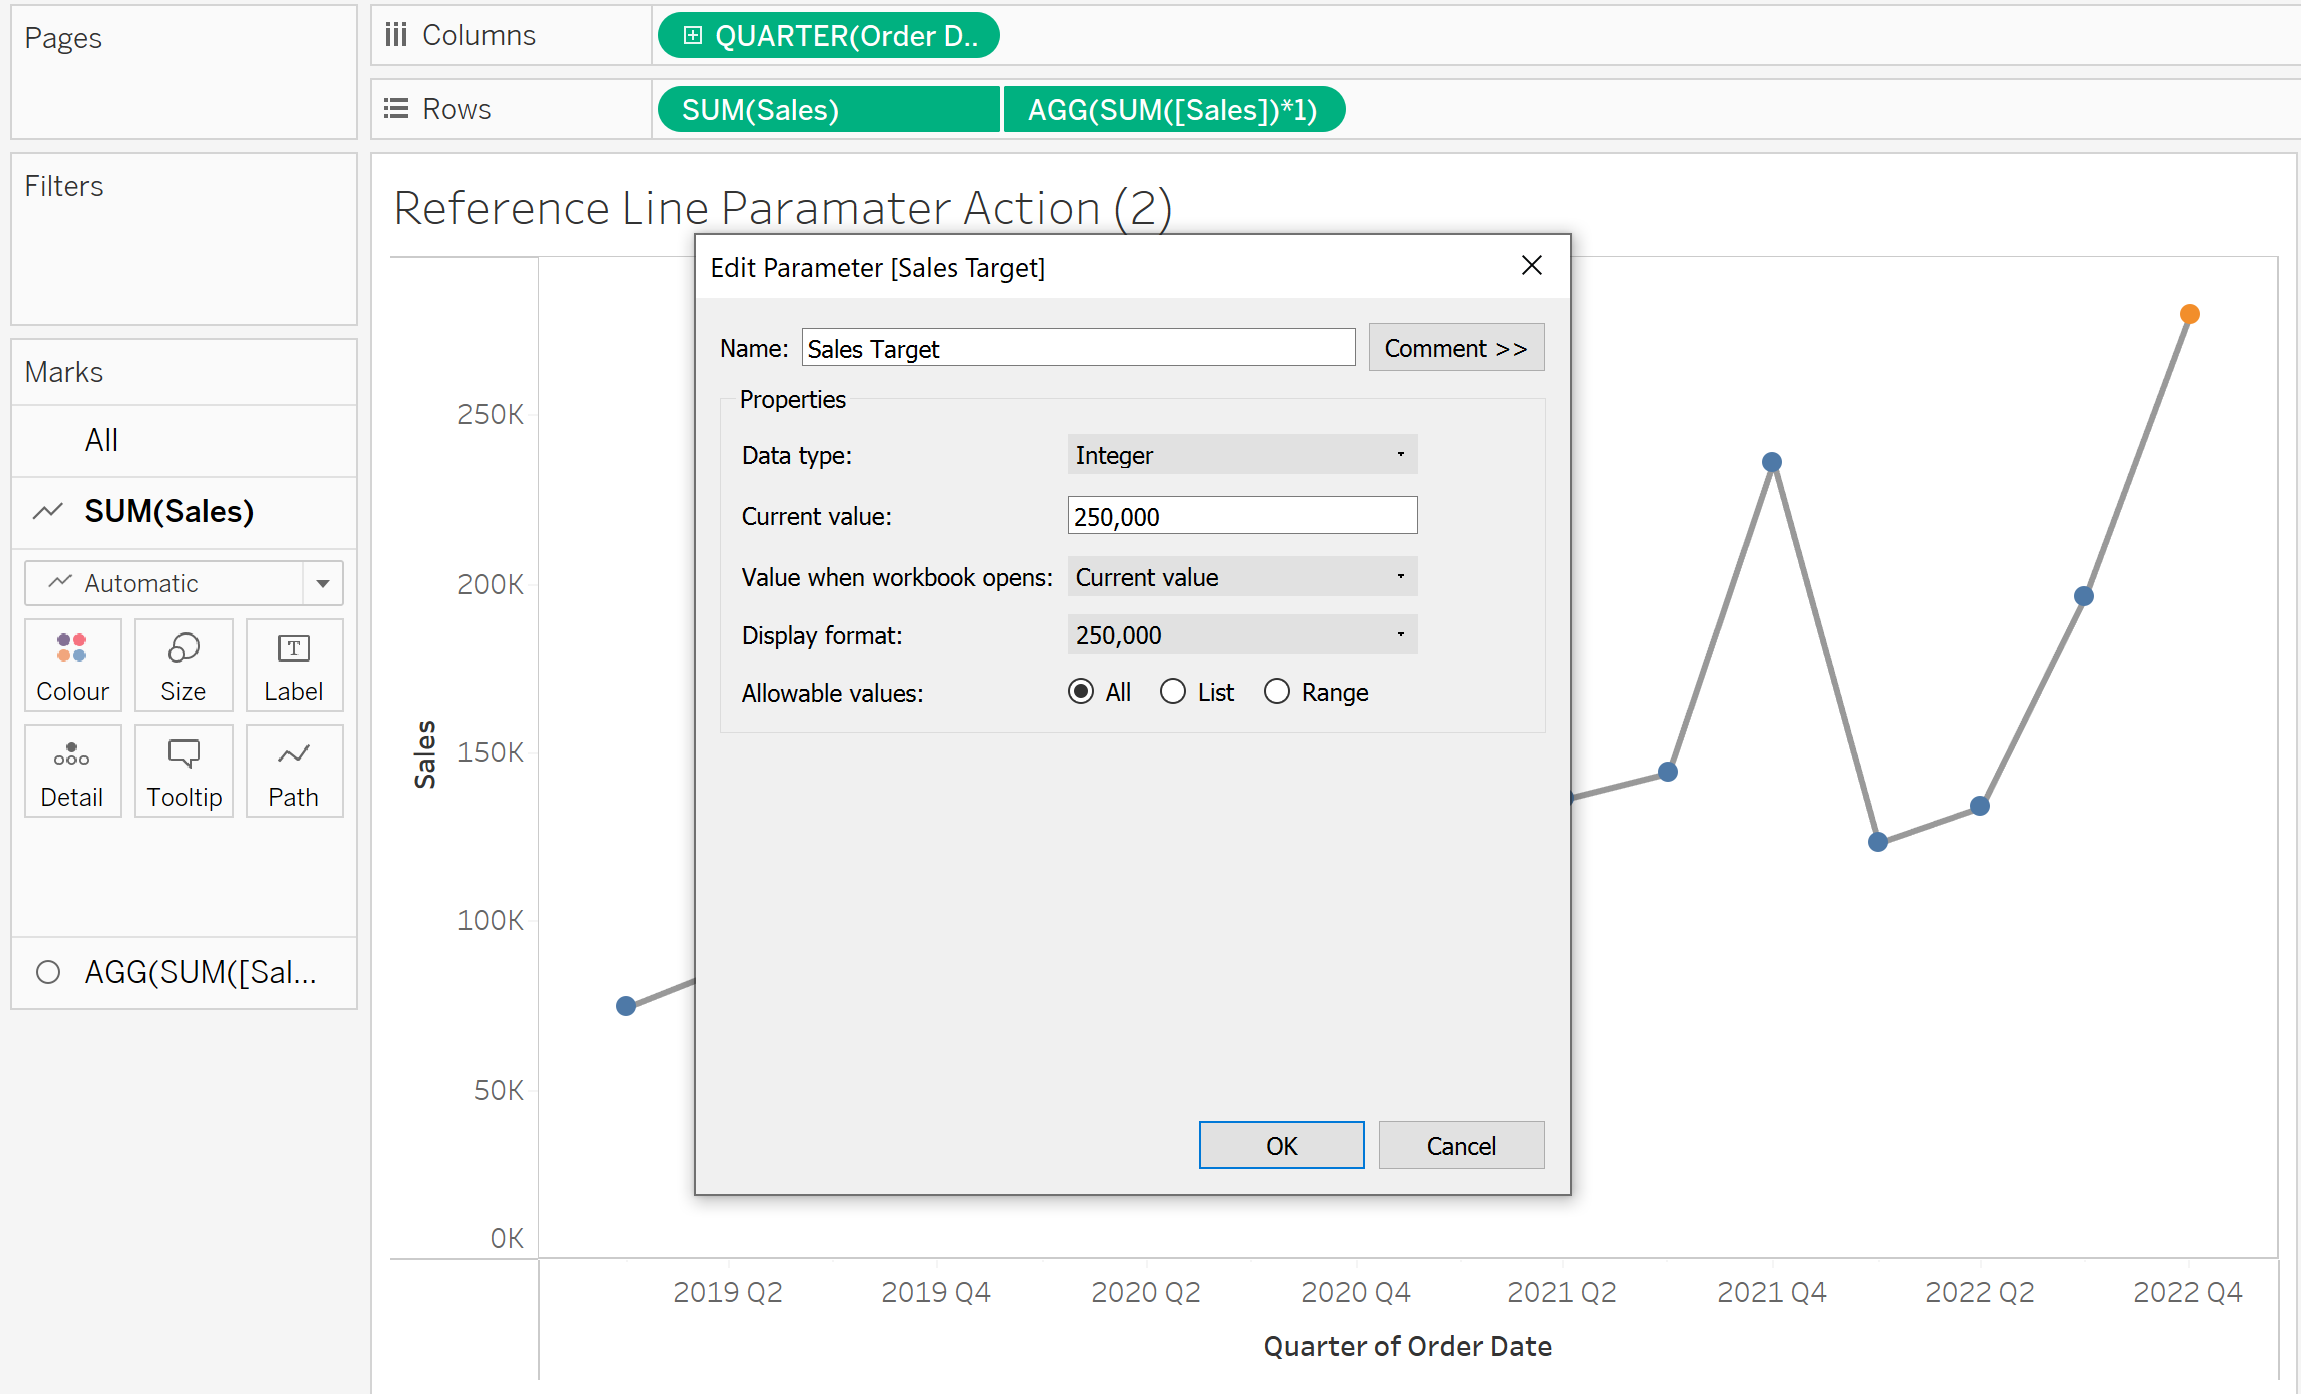
To begin, have your worksheet created with a graph that you'd like to populate with a reference line. Create a PARAMETER, name it, change the data type to integer and set the Current value to any number like so:

Once that is done, click OK. To show the PARAMETER you want to find it on your data pane (the left-hand side that houses all your data fields) and right-click the PARAMETER (in my case it was "Sales Target") and click the second option: Show Parameter.
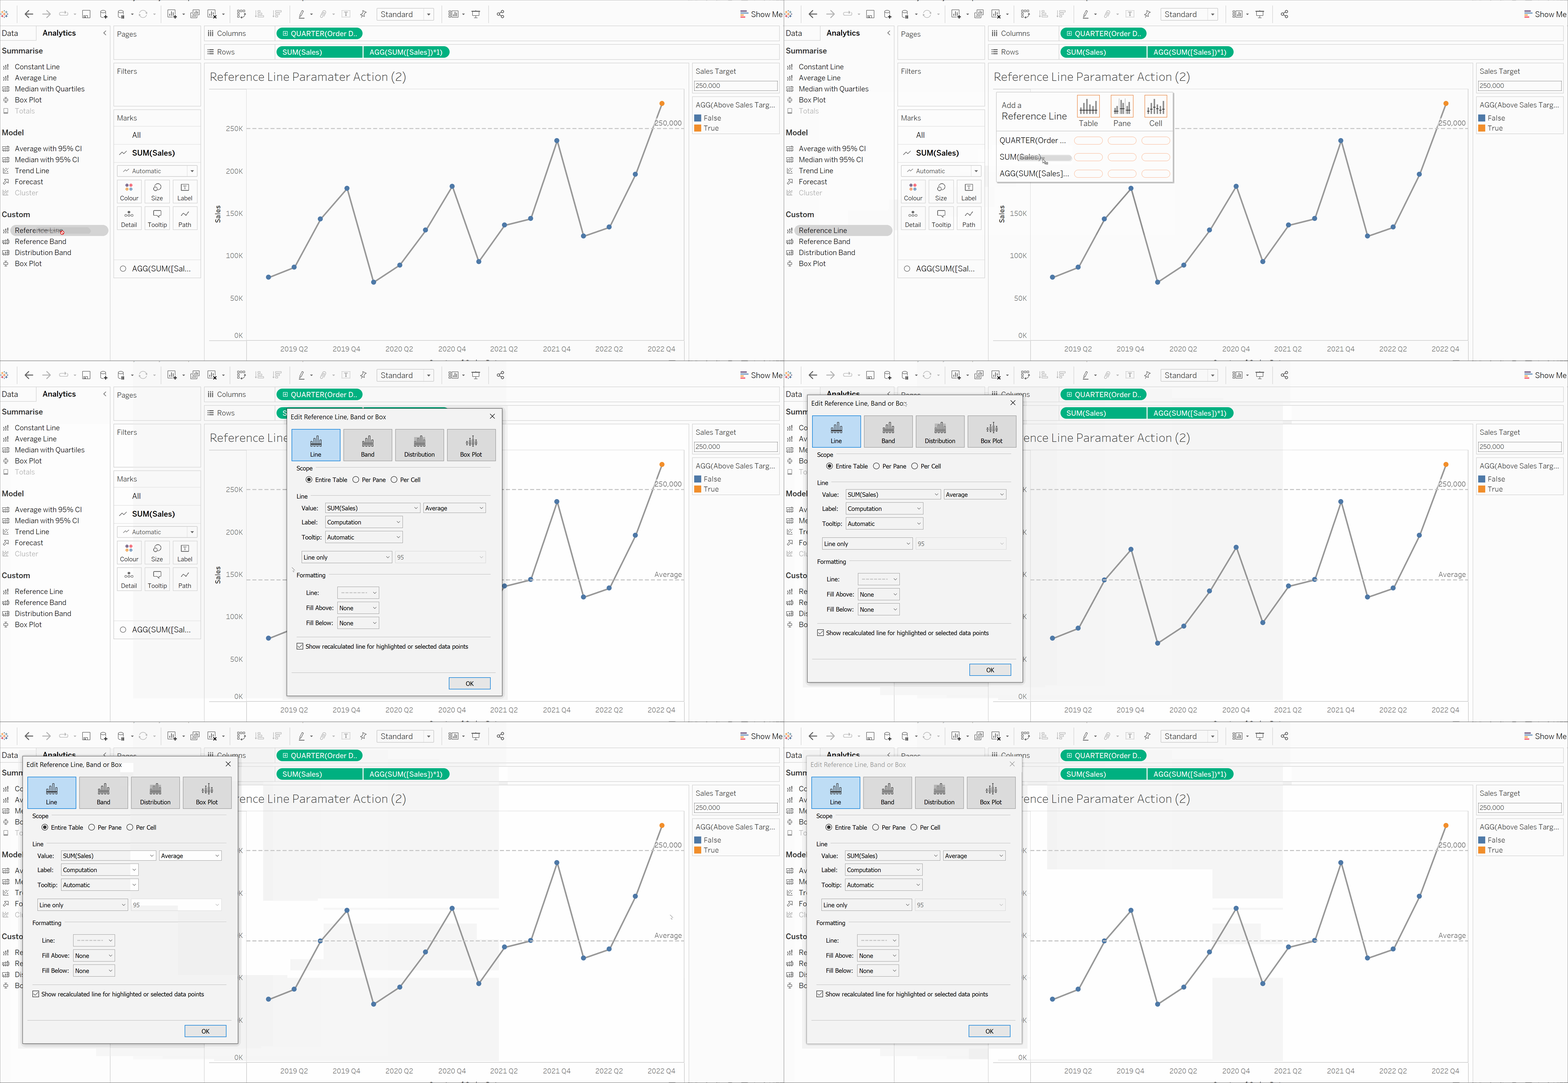
Once the PARAMETER is shown, drag a REFERENCE LINE from the Analytics pane onto the worksheet and hover it over your measure on the table section. For example:

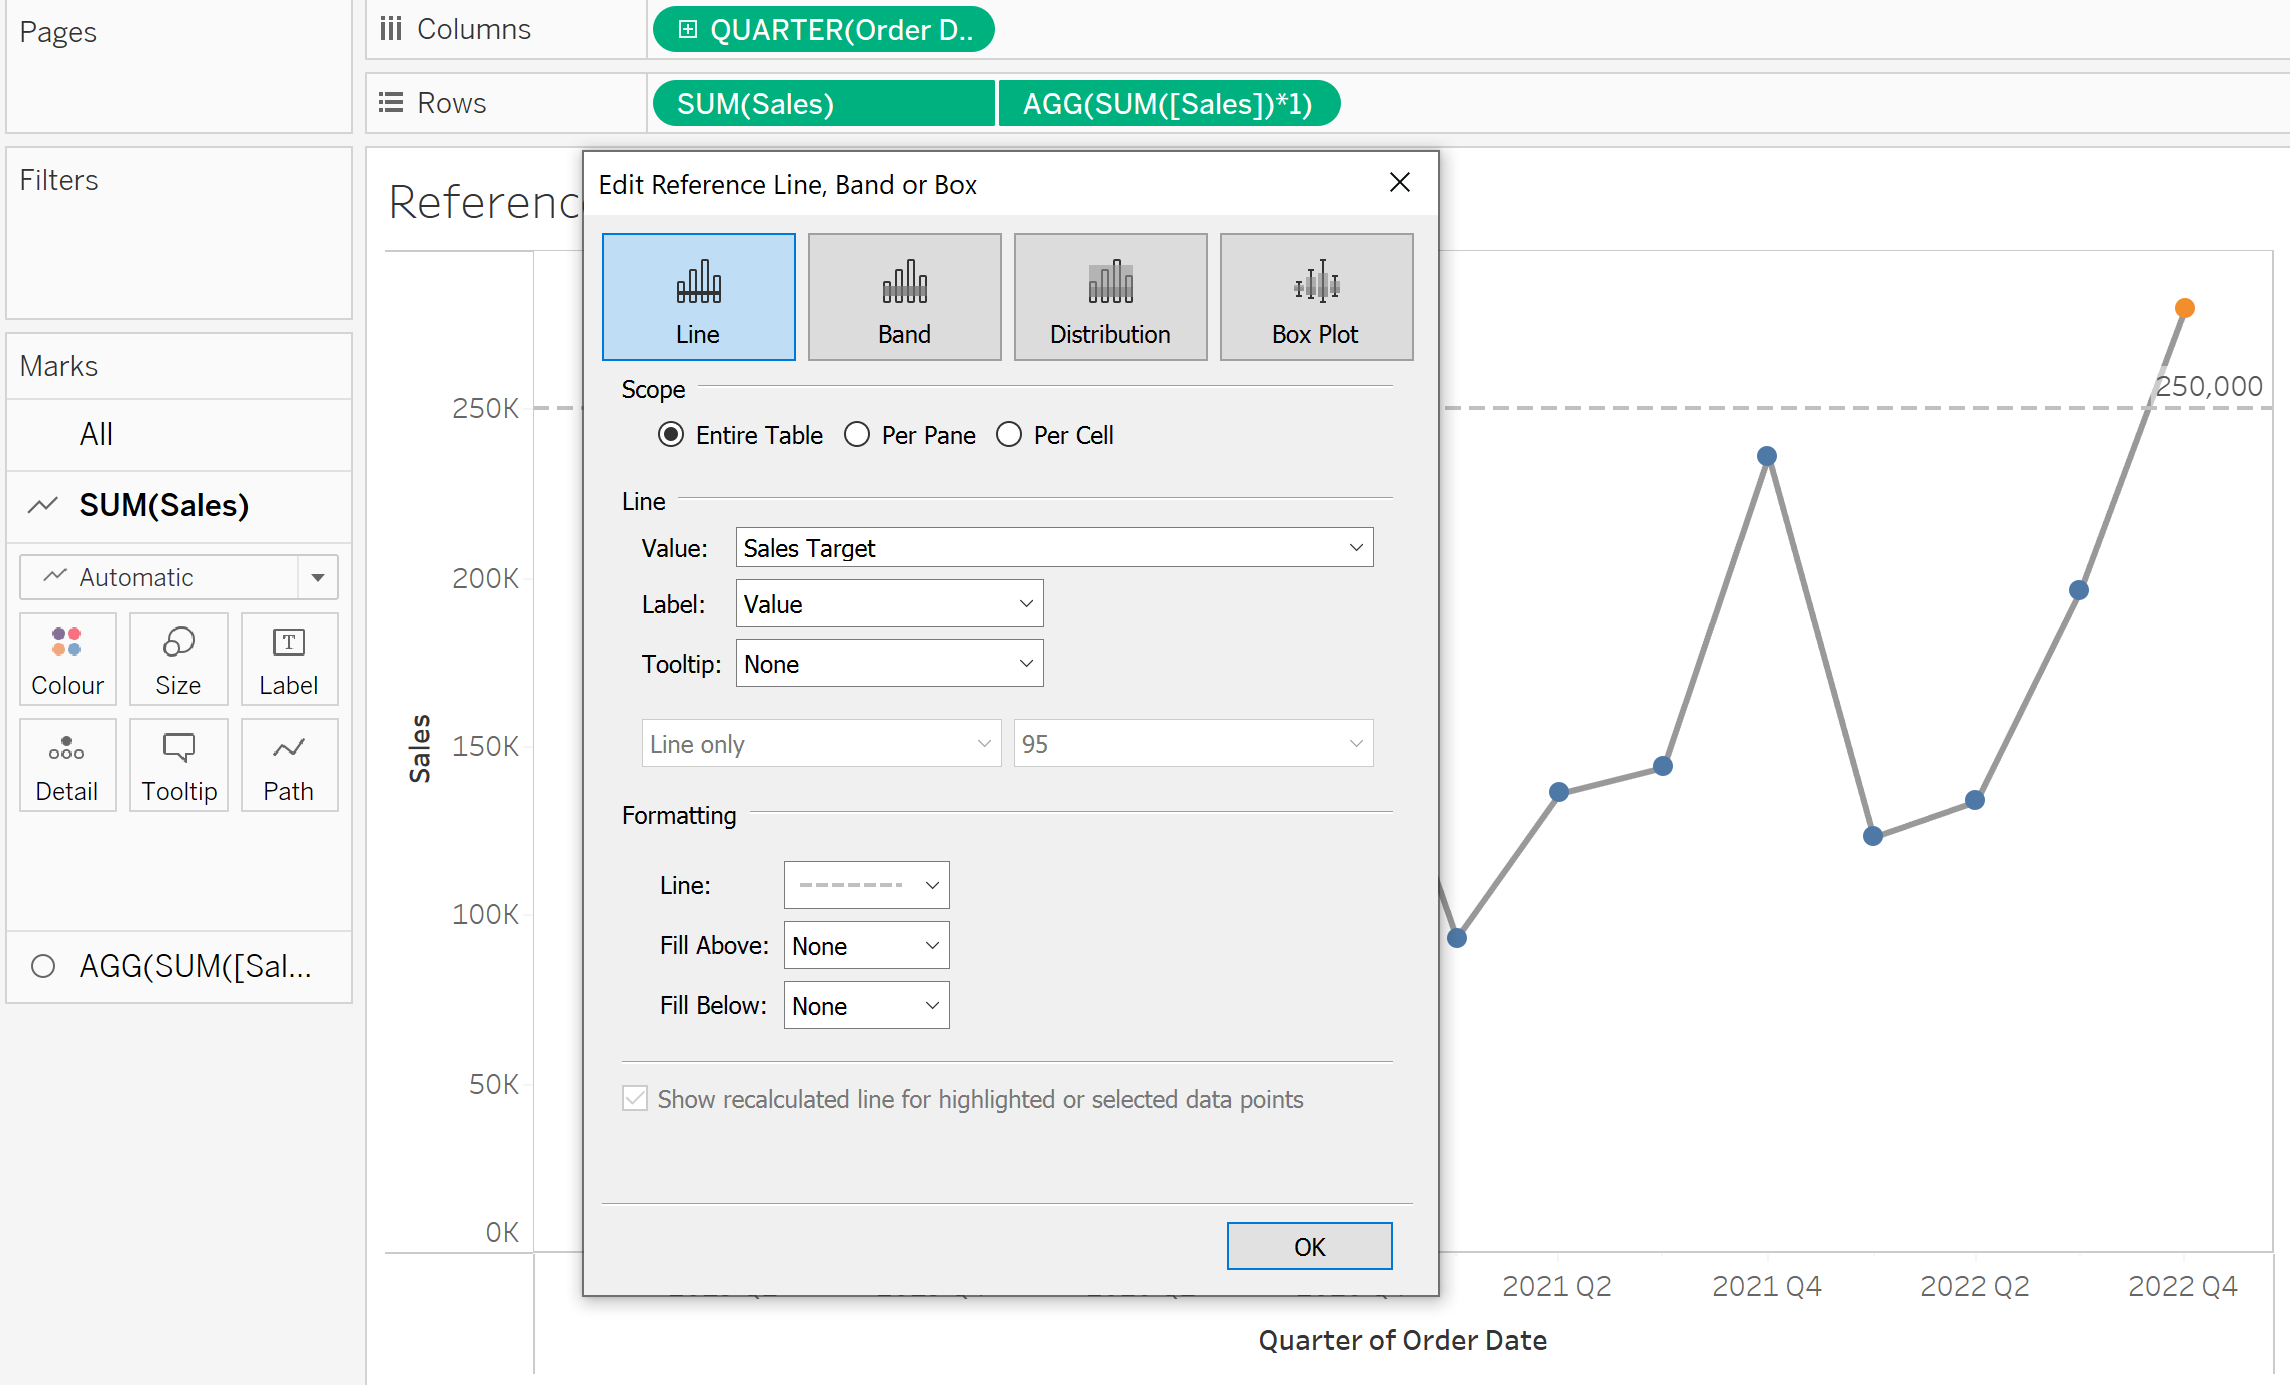
Now, choose your scope and choose your line value as your PARAMETER. Play around with everything else to meet your needs. Every time that you now change the value on your PARAMETER screen on the right, it should move the reference line with it.

But sometimes, this isn't enough. What if you have a graph which is much more populated and is over a longer period of time. You might want to compare the values by just clicking on one and it then produces the reference line on that exact value, just like I did on the first GIF.
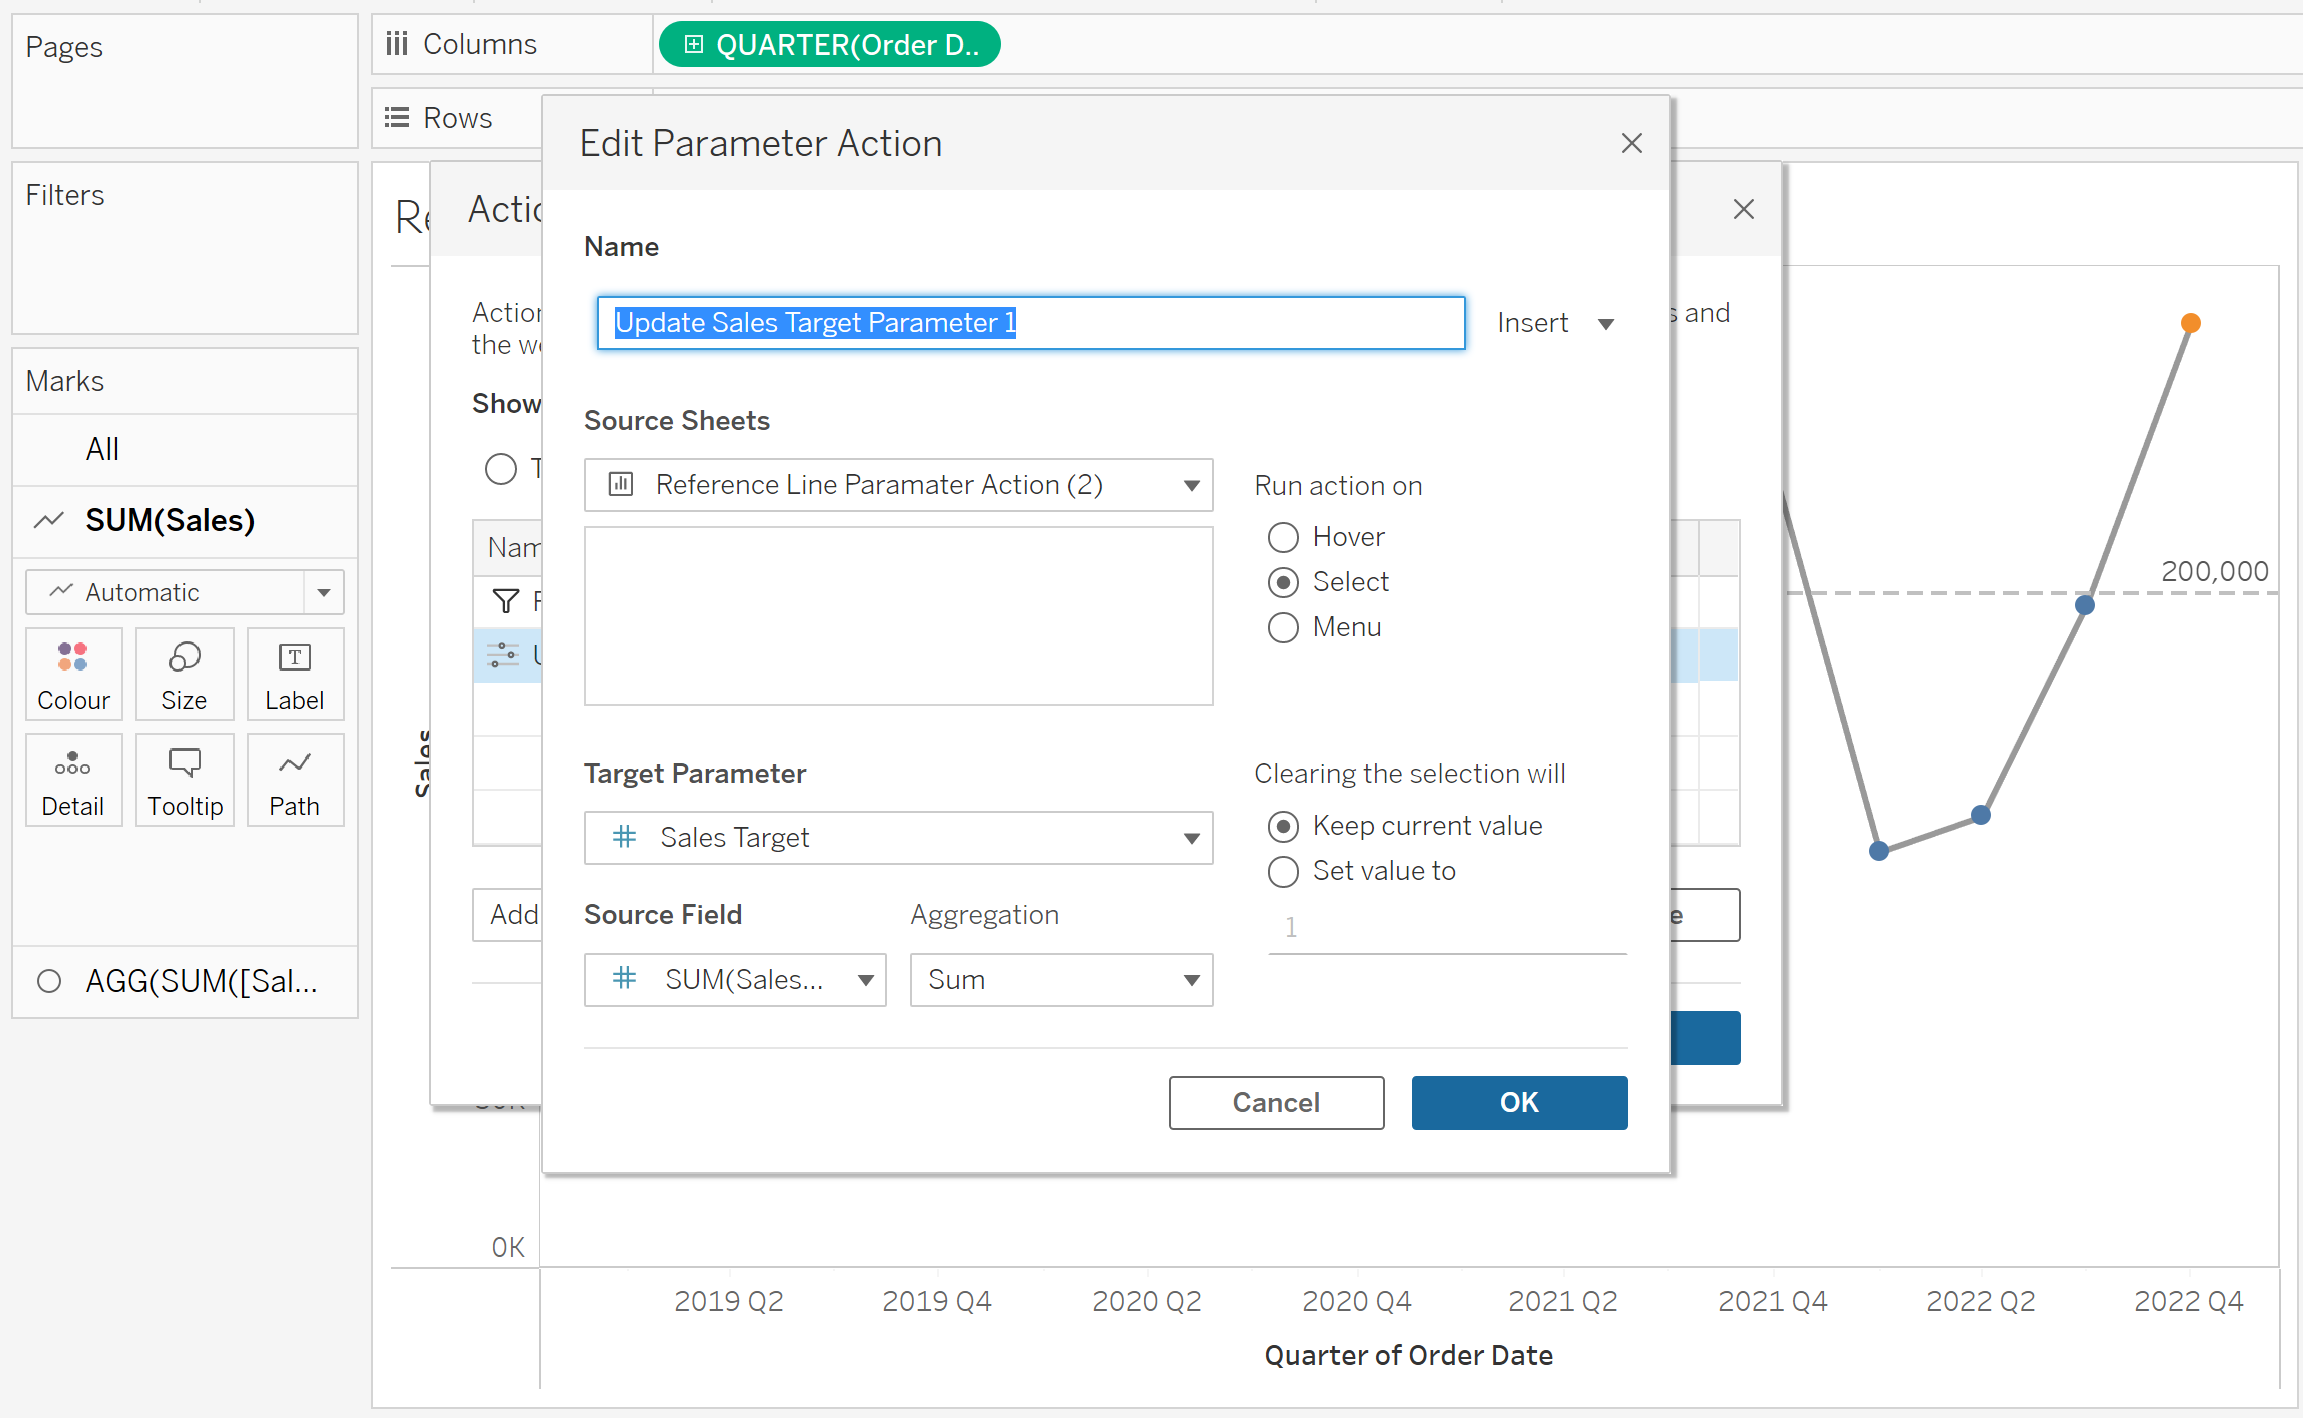
For this, we want to create an ACTION. First, click on the "Analysis" tab on the top of Tableau and click "Actions...". Click "This Sheet" so that the action only works on this sheet (all up to you of course), click the "Add Action" button and choose "Change Parameter...". Choose your selected source sheet, run the action on "Select", and check your "Target Parameter" as the PARAMETER used for your REFERENCE LINE. Finally, choose the source field which is the measure you are changing in your PARAMETER.

Keep everything else as it was (except for the title) and you should now be able to move your reference line as you click on data points in your graph. Enjoy!
