


When analysing data, we often encounter situations where the granularity doesn't quite match our analytical needs. Your data might list individual countries when you need regional insights, or product SKUs when you want to analyse by product category. This is where Tableau's grouping functionality comes in handy.
What Does Grouping Do In Tableau?
At its core, grouping in Tableau allows you to combine multiple dimension members into a single entity. Think of it as creating a new classification layer on top of your existing data without modifying the source. When you group items:
- You create a new dimension that maintains a relationship to your original data
- Your original data remains unchanged
- You can use the grouped dimension in calculations, visualisations, and filters
- The grouping persists in your workbook, not the data source
This flexibility lets you adapt data to fit your analysis without complex data preparation.
The Two Ways to Create Groups in Tableau
Here are the two approaches to creating groups:
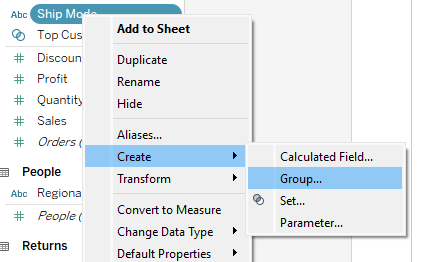
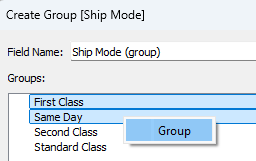
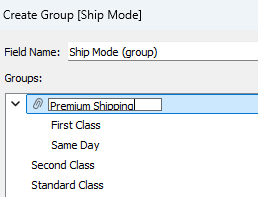
- From the Data pane: Right-click a dimension, select "Create" > "Group". This opens a dialog where you can select members with ctrl + click (⌘ + click for Mac) or shift + click and combine them by right-clicking and selecting (Group). From that menu you can also rename created groups, add more categories to existing groups, and add an "Other" group for all ungrouped categories.
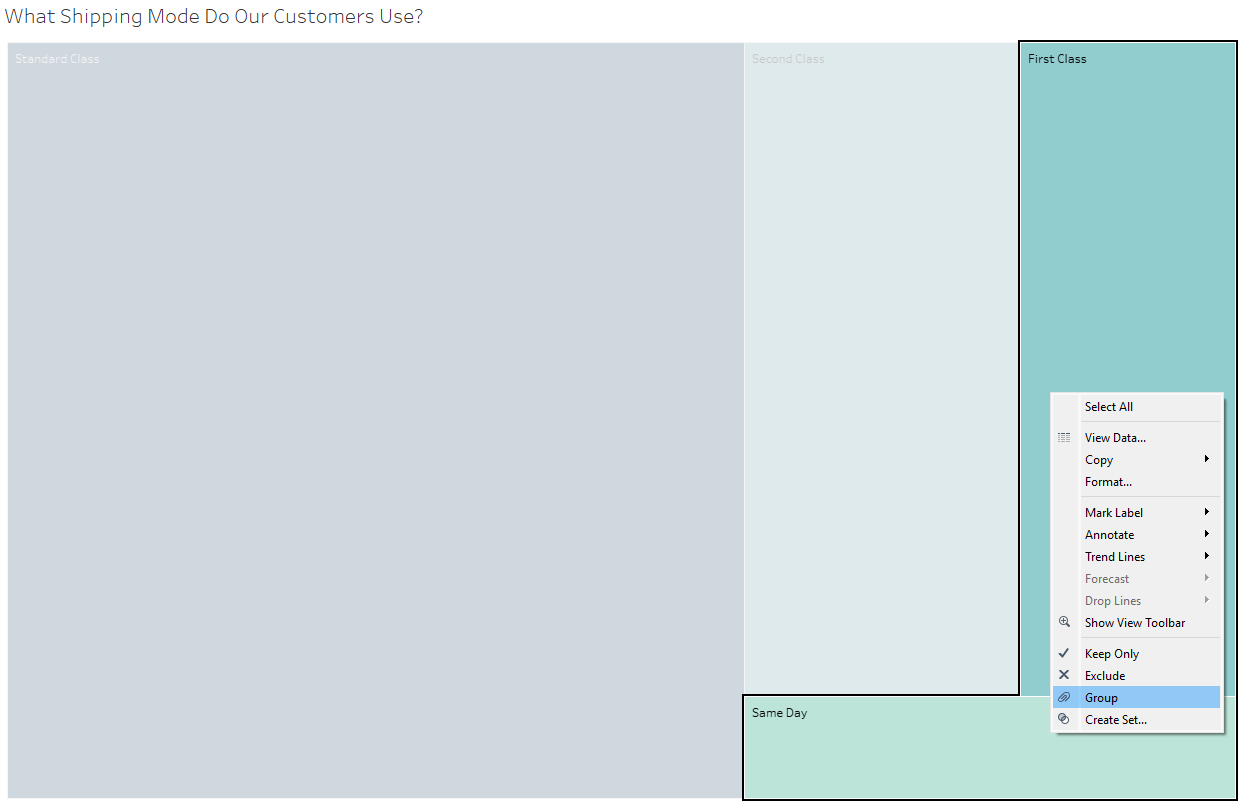
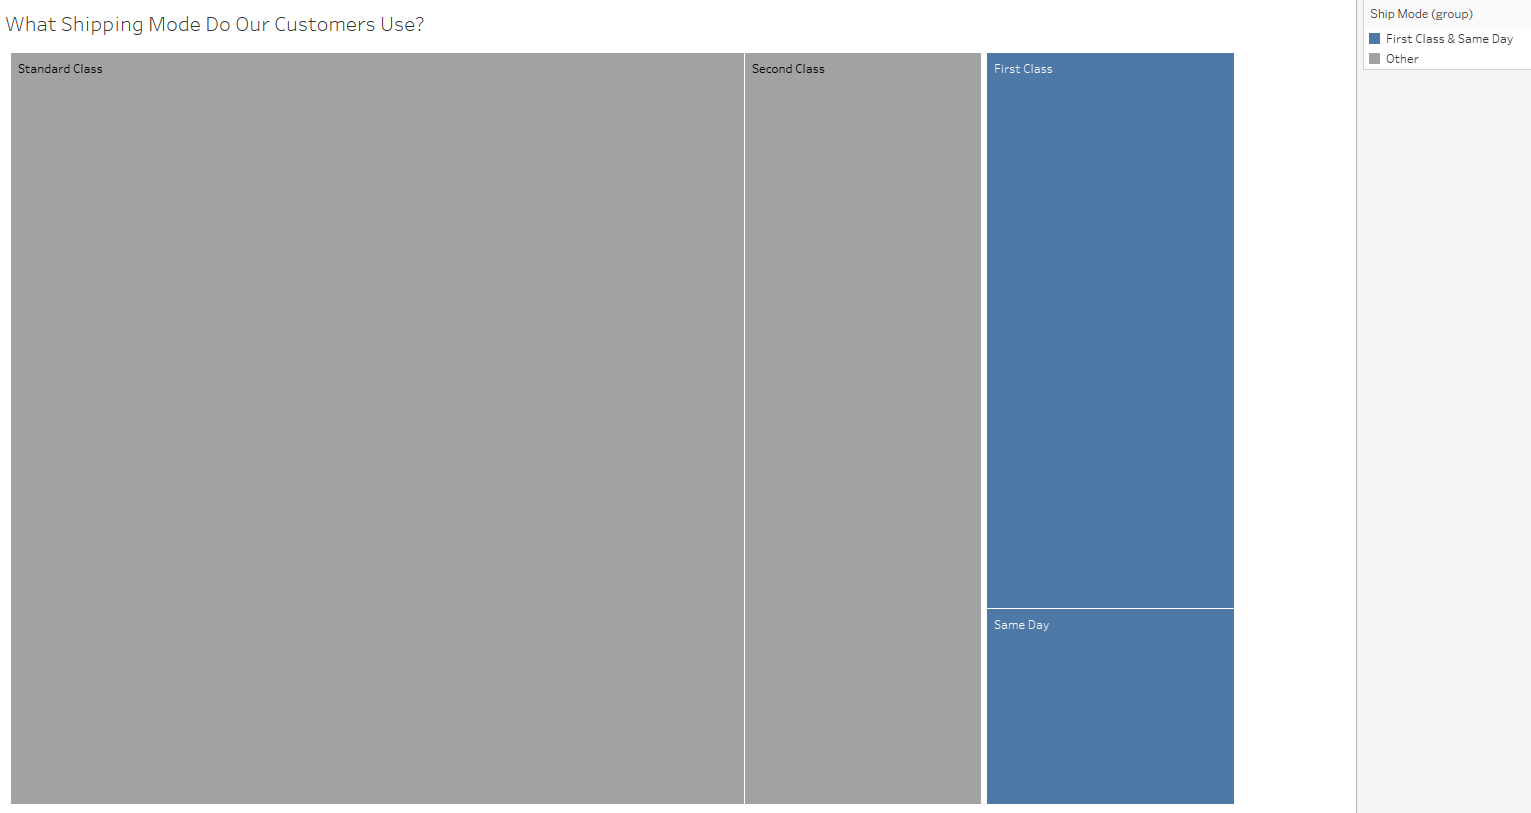
- Directly from the view: Select the data points in your visualisation that you want to group with ctrl + click (⌘ + click for Mac), then click the group option in the tooltip that appears. This will create a new group field with the first group being the one you selected. All other data points will be grouped into an "Other" group. The new group field will automatically be added to your visualisation. This is perfect for quick interactive analysis.
Both methods create a new grouped field that maintains a relationship to your original data while giving you the flexibility to analyse at a different level. If you want to change the new group field (e.g. the names of the groups) after creation, you can right-click the newly created field in the data pane to the left and select "edit".
Maps: Grouping Beyond Country Borders
One of my favourite applications is using grouping for geographical analysis. While Tableau has extensive built-in geographical hierarchies, the highest built-in level you can use is the country-level.
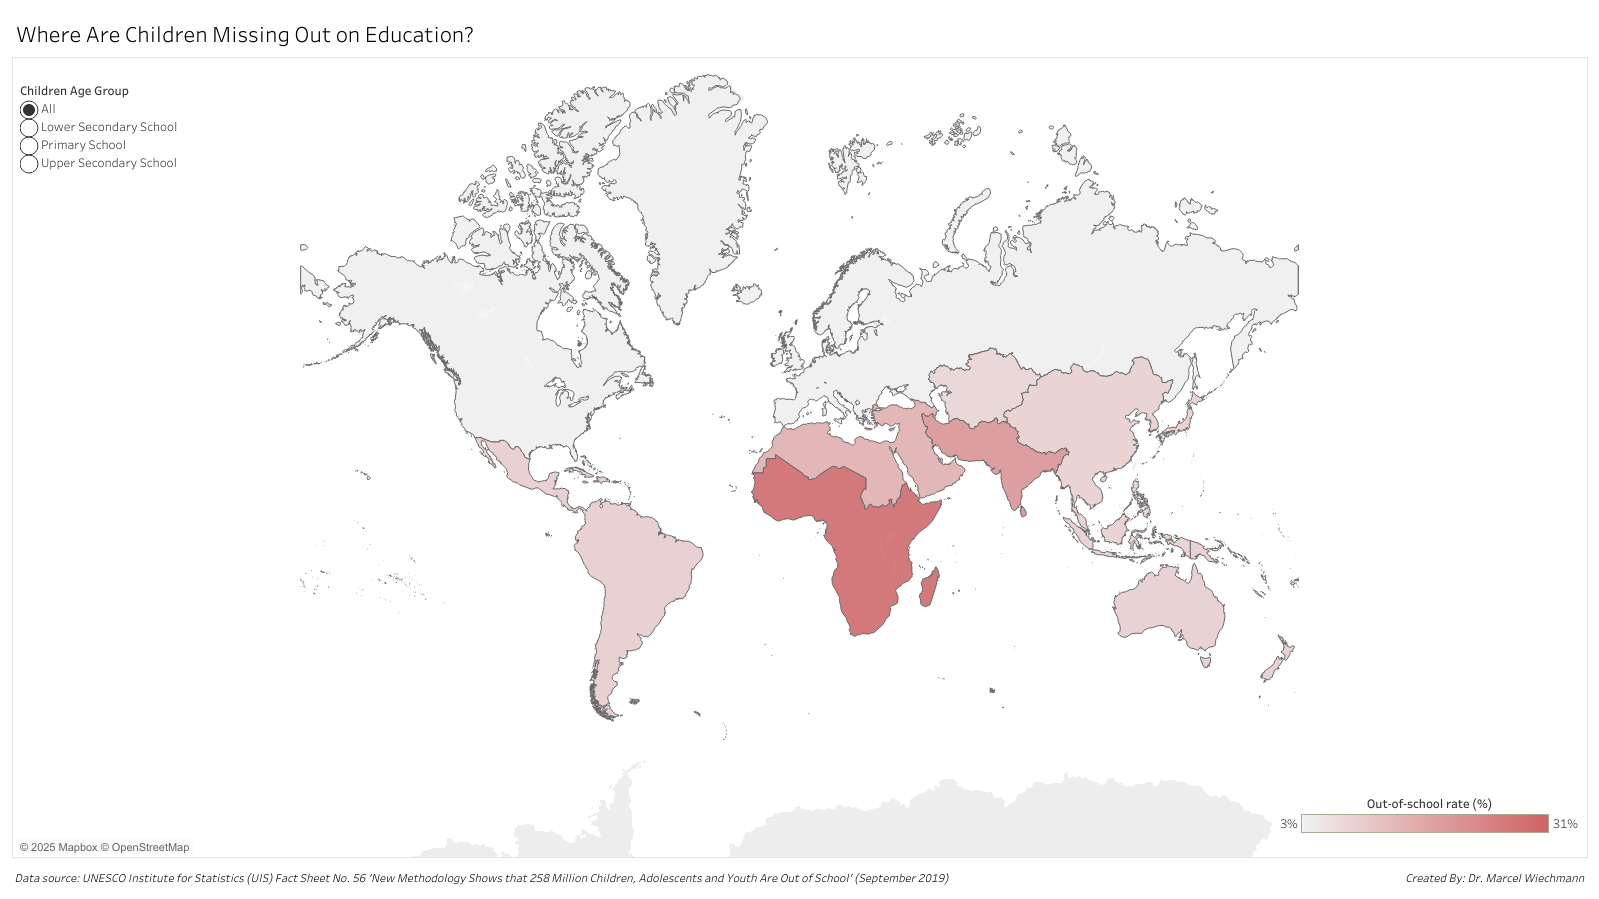
However, many use cases will use their own regional groupings such as "Middle East" or "Latin America and the Caribbean". With group fields, you can easily show these regions as a single entity on a map. Just group the respective countries into their respective region groups. You can see an example of this in my MakeoverMonday of UNESCO data on out-of-school children worldwide, using the UNESCO SDG regional groupings.
Groups vs. Other Tableau Features
Grouping isn't always the best approach. Groups excel when you need to combine dimension members into static categories - like grouping product types into broader product categories (e.g., "Office Chairs", "Desks", and "Filing Cabinets" into "Office Furniture") or consolidating inconsistent data entries (e.g., "USA", "U.S.A", and "United States"). Understanding when to use alternative Tableau features can save you time and create more effective analyses:
- Sets vs. Groups: While groups create static broad categories, sets create a dynamic in/out classification that can be condition-based. Use sets when you need to identify members that meet specific criteria that might change as your data updates.
- Hierarchies vs. Groups: Hierarchies organise multiple fields into drill-down paths (like Region > Country > State > City), allowing you to navigate through different levels of detail. Use hierarchies when you need structured navigation through related dimensions, rather than combining individual members within a single dimension. Note that groups and hierarchies can complement each other - after creating groups to form broader categories (like grouping product types into product categories), you can include both fields in a hierarchy for drill-down analysis.
- Parameters with Calculated Fields: If you want to implement user-controlled grouping that can change dynamically based on user selection, use parameters with calculated fields rather than static groups.
Conclusion
Tableau's grouping functionality provides an elegant way to simplify complex data and focus on the insights that matter most. Whether you're combining similar categories to reduce clutter, correcting inconsistent data entries, or creating custom geographical regions for your analysis, groups help you analyze data at the level that makes the most sense for your specific questions.
The next time you find yourself struggling to see patterns in overly granular data, remember that grouping might be the solution. Start with simple groups and experiment with the different ways you can leverage this flexible feature in your own dashboards.
Grouping: For When Less Is More
Sometimes the best way to understand your data is to simplify it first. That's what grouping in Tableau lets you do - combine similar things to see the bigger picture.
When your data has too many individual categories, grouping helps you cut through the noise. The main strength of grouping is creating those broader, meaningful categories that make your analysis clearer. It's also handy for tidying up inconsistent data entries and building custom geographical regions that don't exist in Tableau's built-in maps.
Give them a try next time your visualisation feels too cluttered - sometimes less really is more.