


Alteryx Challenge #472 looked at a topic close to home for many parents around the world: calculating the cost of school supplies for one child in each grade of elementary school (from kindergarten to sixth grade).
There were 2 inputs for this challenge:
- School supply list - a list of school supplies required for each child separated by grade
- Cost of school supplies - the cost of each unit from a list of school supplies
If you want to have a shot at solving it yourself before you read on, you can find the challenge here.
My Solution (Spoiler Warning!)
Step 1
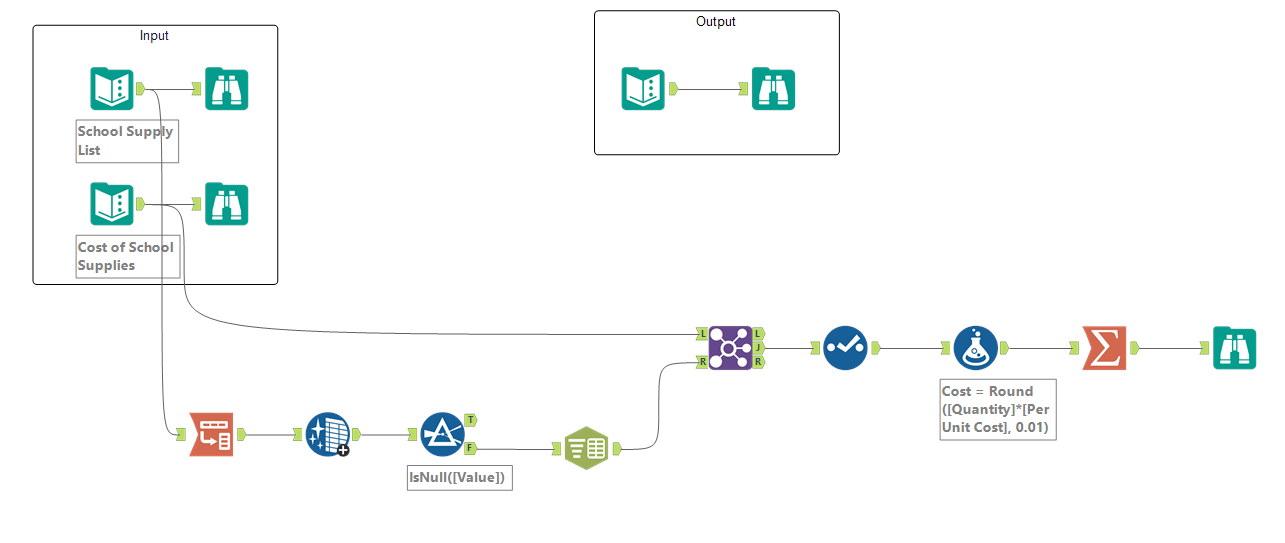
After having a look at the inputs and what output we were trying to achieve, I first chose to use the Transpose tool to pivot the 7 fields that held information about the quantity of each school supply needed for each grade in the School Supply List table.
This was essential because the original data was in a wide format with each grade as a separate column. To perform further analysis or join this data with other tables (like a master list of pricing), I needed the data in a long format (where each row represents a single grade-supply combination).
Step 2
A quick scroll through the pivoted table showed me that some of the fields in the Value column (representing the quantity of school supplies needed) were formatted in different ways. Namely, letter case was inconsistent and there was also a * at the beginning of the fields that we didn’t need.
Therefore, I dragged in the Data Cleansing tool to remove unwanted characters (leading/trailing whitespace and punctuation) and modify case to title case. This helped ensure that there wouldn’t be any issues later down the line when joining the 2 tables.
Step 3
You would have noticed by now that some of the fields in the Value column are null - this was carried over from the original School Supply List data. As we don’t need these anymore, I used the Filter tool to quickly filter out all null values from the Value column.
Step 4
As we are interested in calculating the total price of school supplies for each grade, we need to determine what quantity of each item is required. We already have this information but it's kept in the same column which isn’t ideal for calculations. So, to separate the data, I used the Text To Columns tool to split the column into 2 with an empty space as a delimiter.
Step 5
Now that we have separate columns for School Supply and Quantity, we can begin calculating the total cost per grade. To do this, we first need to bring in the unit cost of each supply item. I used the Join tool to perform an inner join between the School Supply List data and the Cost of School Supplies data, matching on the field that contains the name of the school supply in each table.
Step 6
To ensure that our calculations work as they should, we need to change the data type of our Quantity column from string to numeric. I did this by using the Select tool to change the column type as well as rename it and remove columns that are no longer needed for the final input.
Step 7
We can now finally calculate the total cost of school supplies for each grade! I started doing this by using the Formula tool with the following calculation:
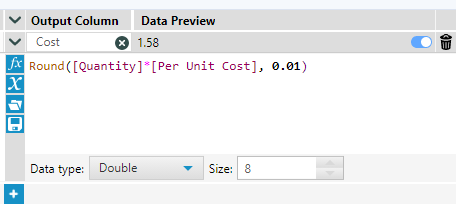
Step 8
As the previous step only got us the cost of each school supply by grade, we now need to calculate the total cost by grade. I did this by using a Summarise tool to group by Grade and sum Cost into the Full Cost of School Supplies:
Step 9
Finally, I added in another Browse step just to double check that the output looks as it should.
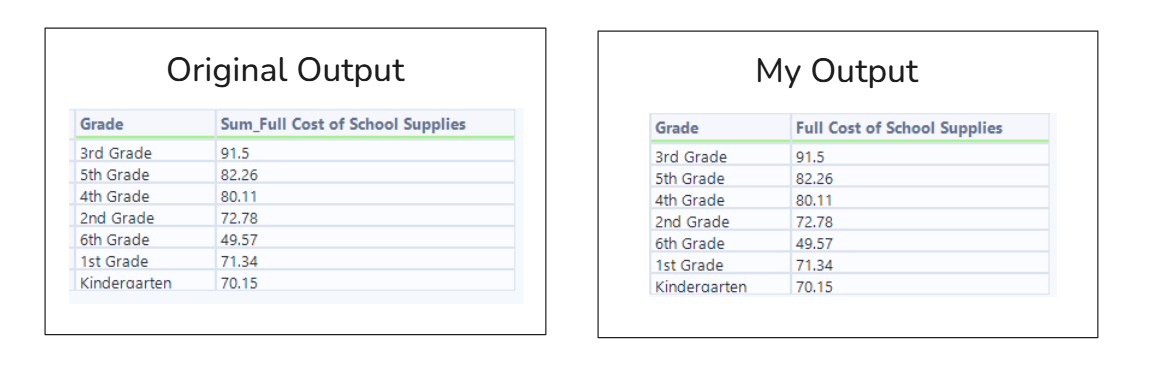
And there we go! Alteryx Challenge #472: Complete!