Power Bi - Top N

The goal is to create a visual for the Top 5 Sub-Categories with the highest average discount.

Connected to Sample Superstore Dataset.

Change the aggregation of a field:

If you want to change the aggregation of the field from sum to anything else, below is how you would do it.
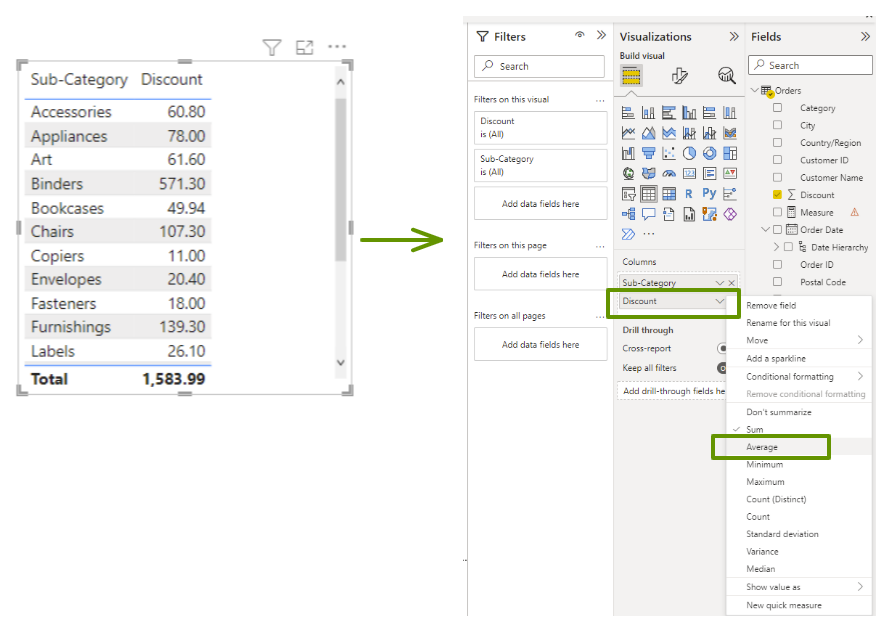
Once the table has been created - under visualization, arrow down - now able to change the aggregation

How to Create Top N:

You can again change aggregation of the value

You have now successfully created a top 5 of average discount by sub-category.

Author:
Maha Hussari
Powered by The Information Lab
1st Floor, 25 Watling Street, London, EC4M 9BR
Subscribe
to our Newsletter
Get the lastest news about The Data School and application tips
Subscribe now
© 2024 The Information Lab