


I always forget how to make a drill down bar chart so this blog will go through with how to make it.
- There is no need for hierarchies when doing drill downs.
- Start with SUM(Sales) and Category in the view
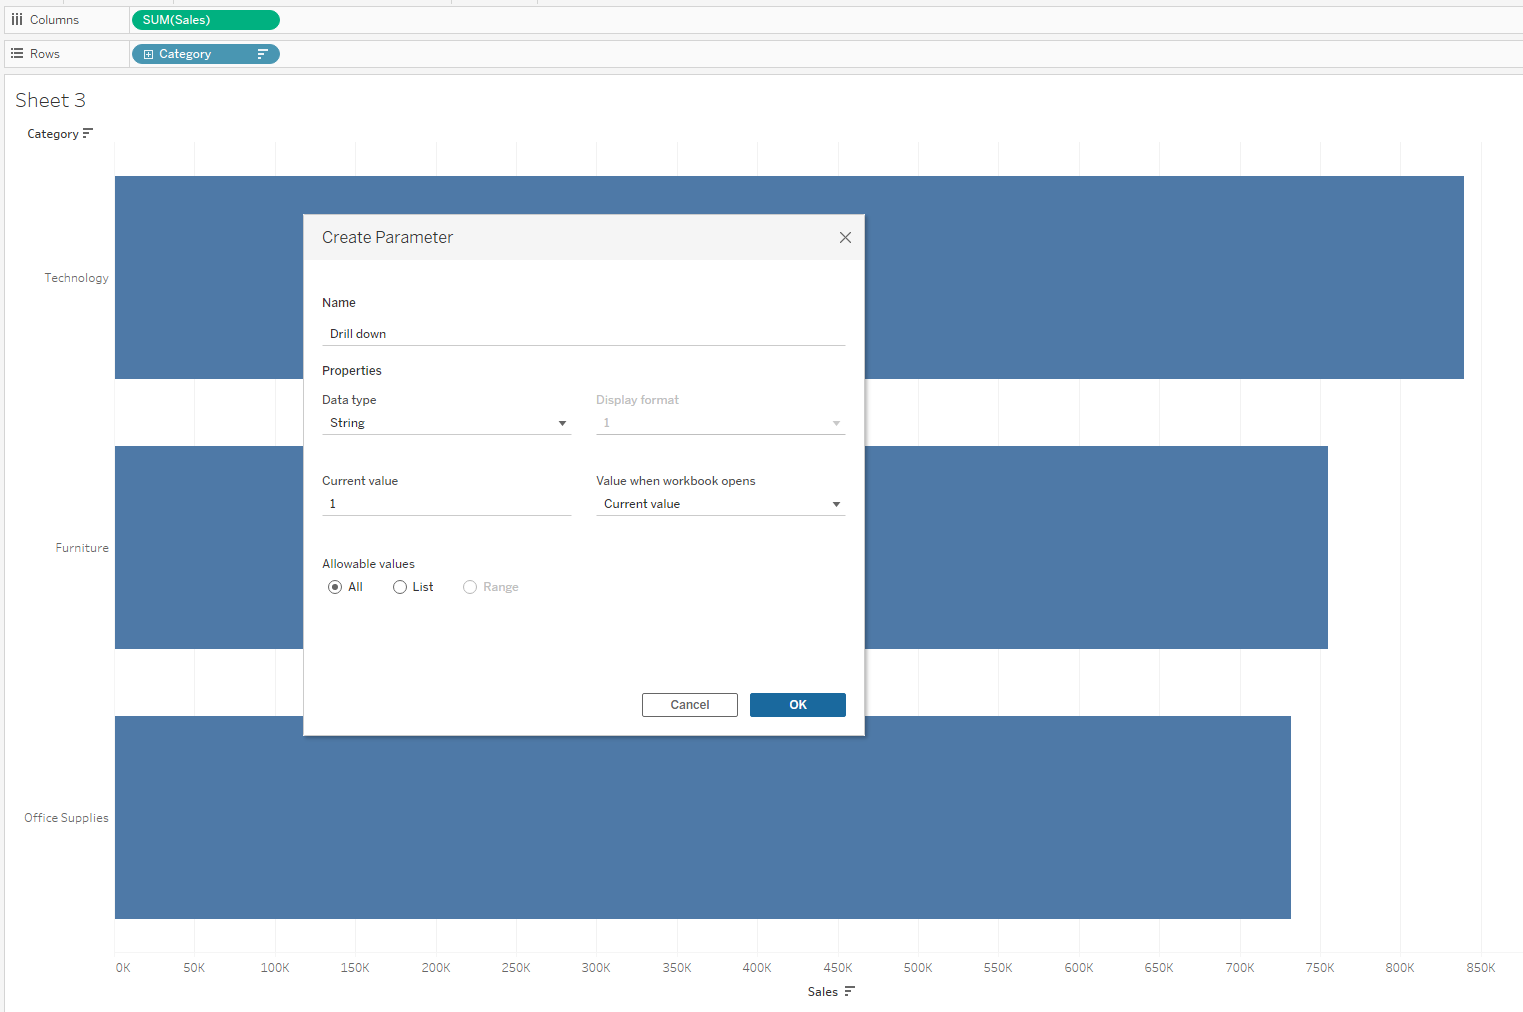
- Create a parameter - String Type
- Show parameter
4. Create a calculated field -> This is to wire in the Parameter we just created
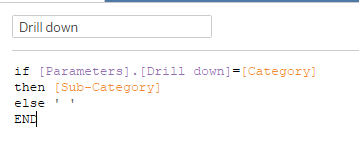
IMPORTANT:
- The 'Sub-Category' can be changed to anything you want to drill down into (For Example, it can be Segment or Order ID) - It does not need to be a hierarchy.
5. Add the new calculated field into the rows next to the Category
6. Make a parameter action
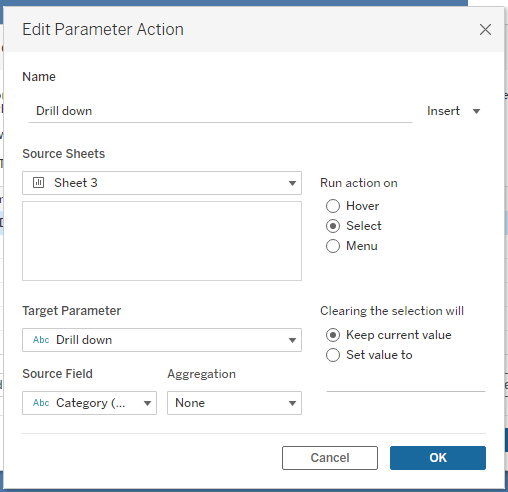
Now when you click on one of the category's, it will open/drill down into the next field
7. Create another calculated field to have the arrows show when you drill down (▲ ,▼, ▶ )
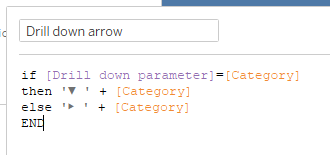
8. Add the arrows calculated field into the middle and hide the category label
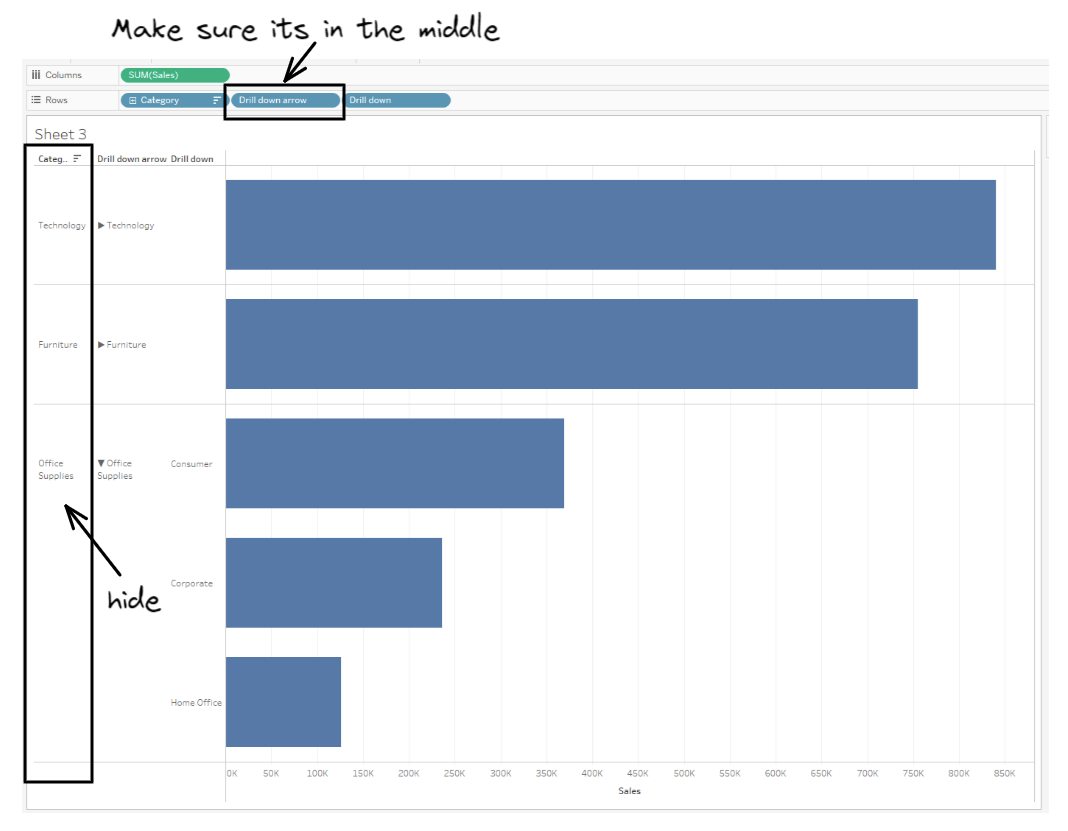
And you are done!
You have successfully created a drill down bar chart using a parameter action!