


Picture the scene: you've built a dashboard with some lovely interaction controlled by parameter and / or set actions. You open the dashboard and select a mark to trigger an action.... And everything goes grey.
Okay maybe not everything.
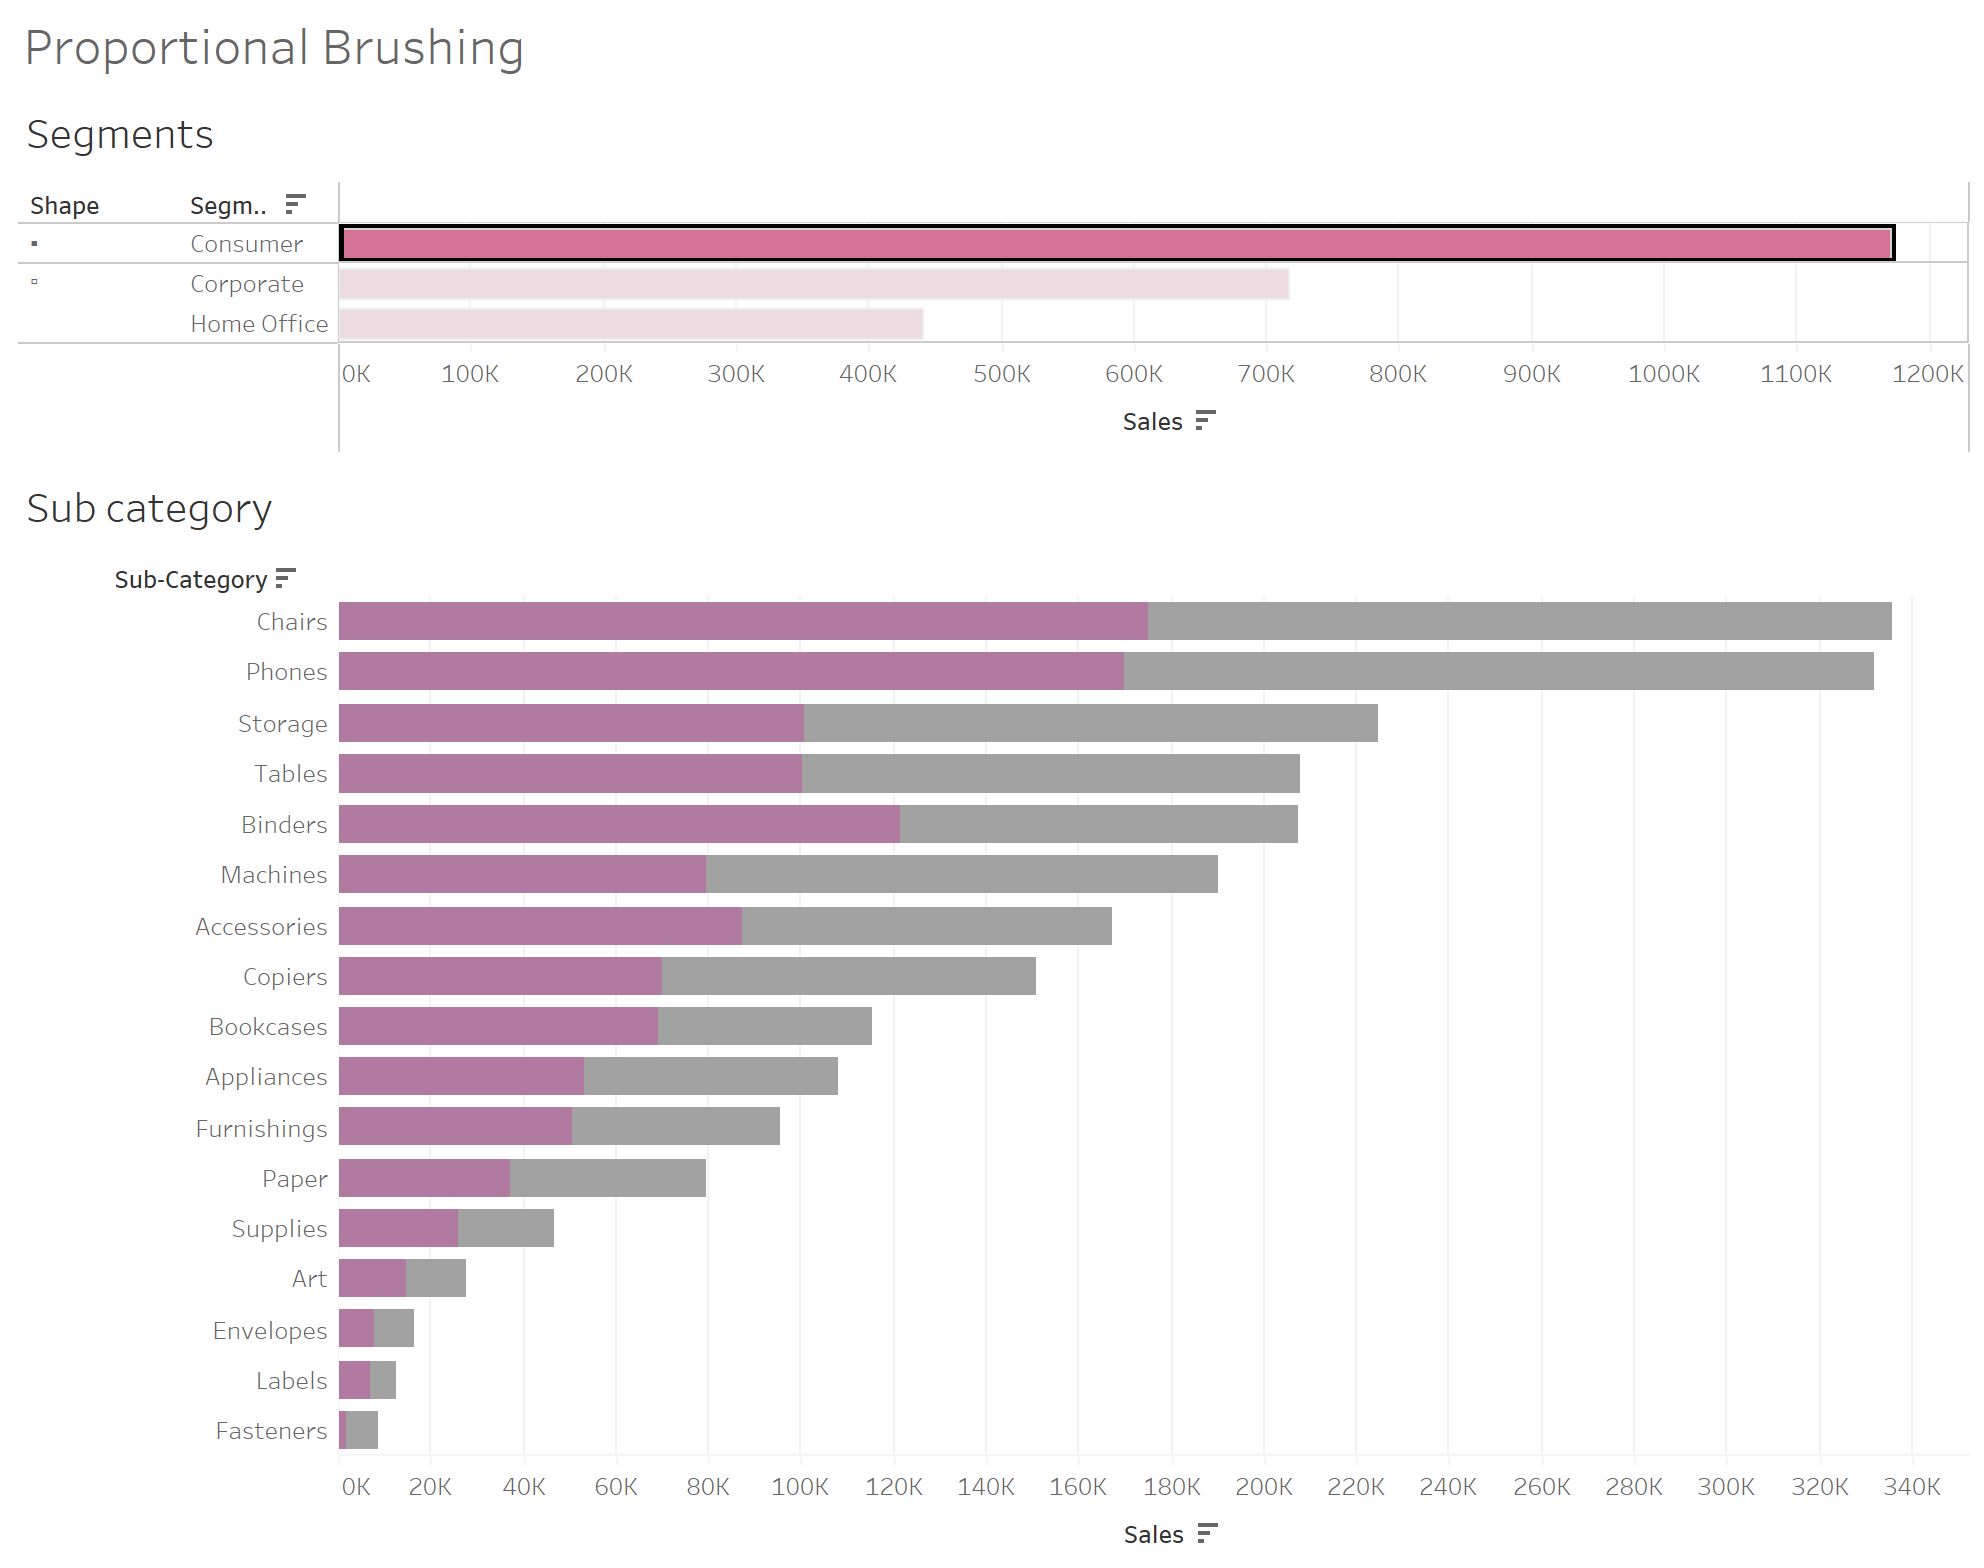
Above is an example of proportional brushing. When a segment is selected on the top chart, the proportion of the sub-category in the lower chart is shaded accordingly - this can be done with set or parameter actions.
Tableau automatically greys out the segments in the top chart which are not selected. While this has its use cases - its not what I want in this case. I want all my segments to be displayed in pink.
To rectify this we need to add a dummy highlight.
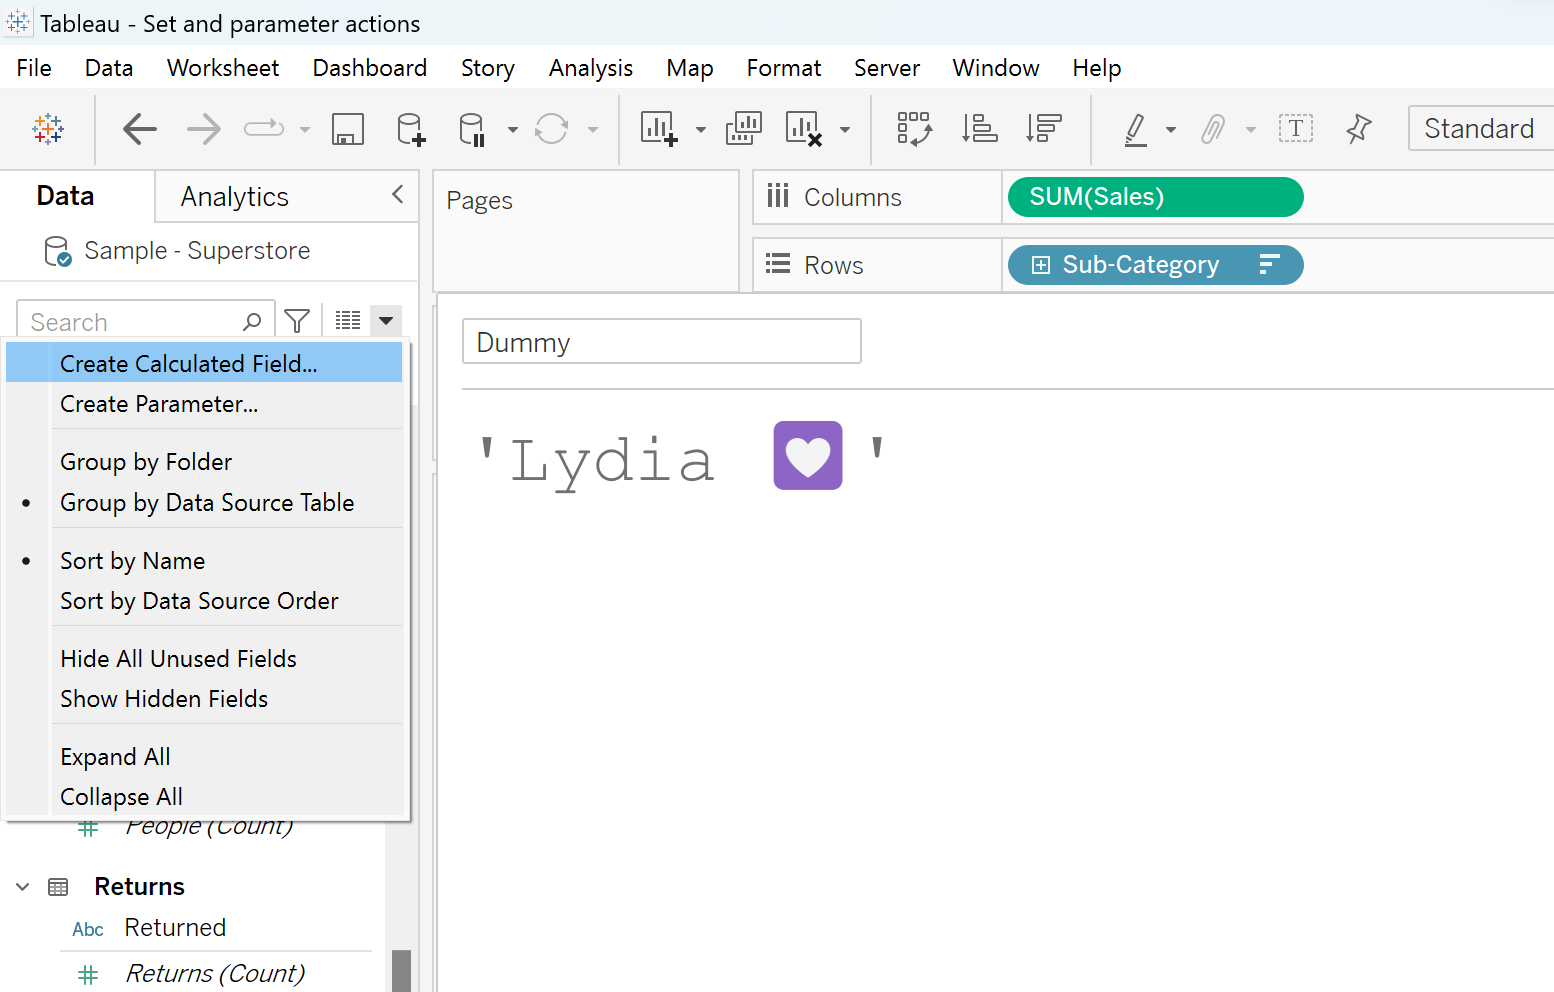
First, create a calculated field. Name it dummy and give it any string value (pro tip, you can zoom into you calculations by holding ctrl and scrolling):
Second, add the dummy to the detail card of every chart on the dashboard.
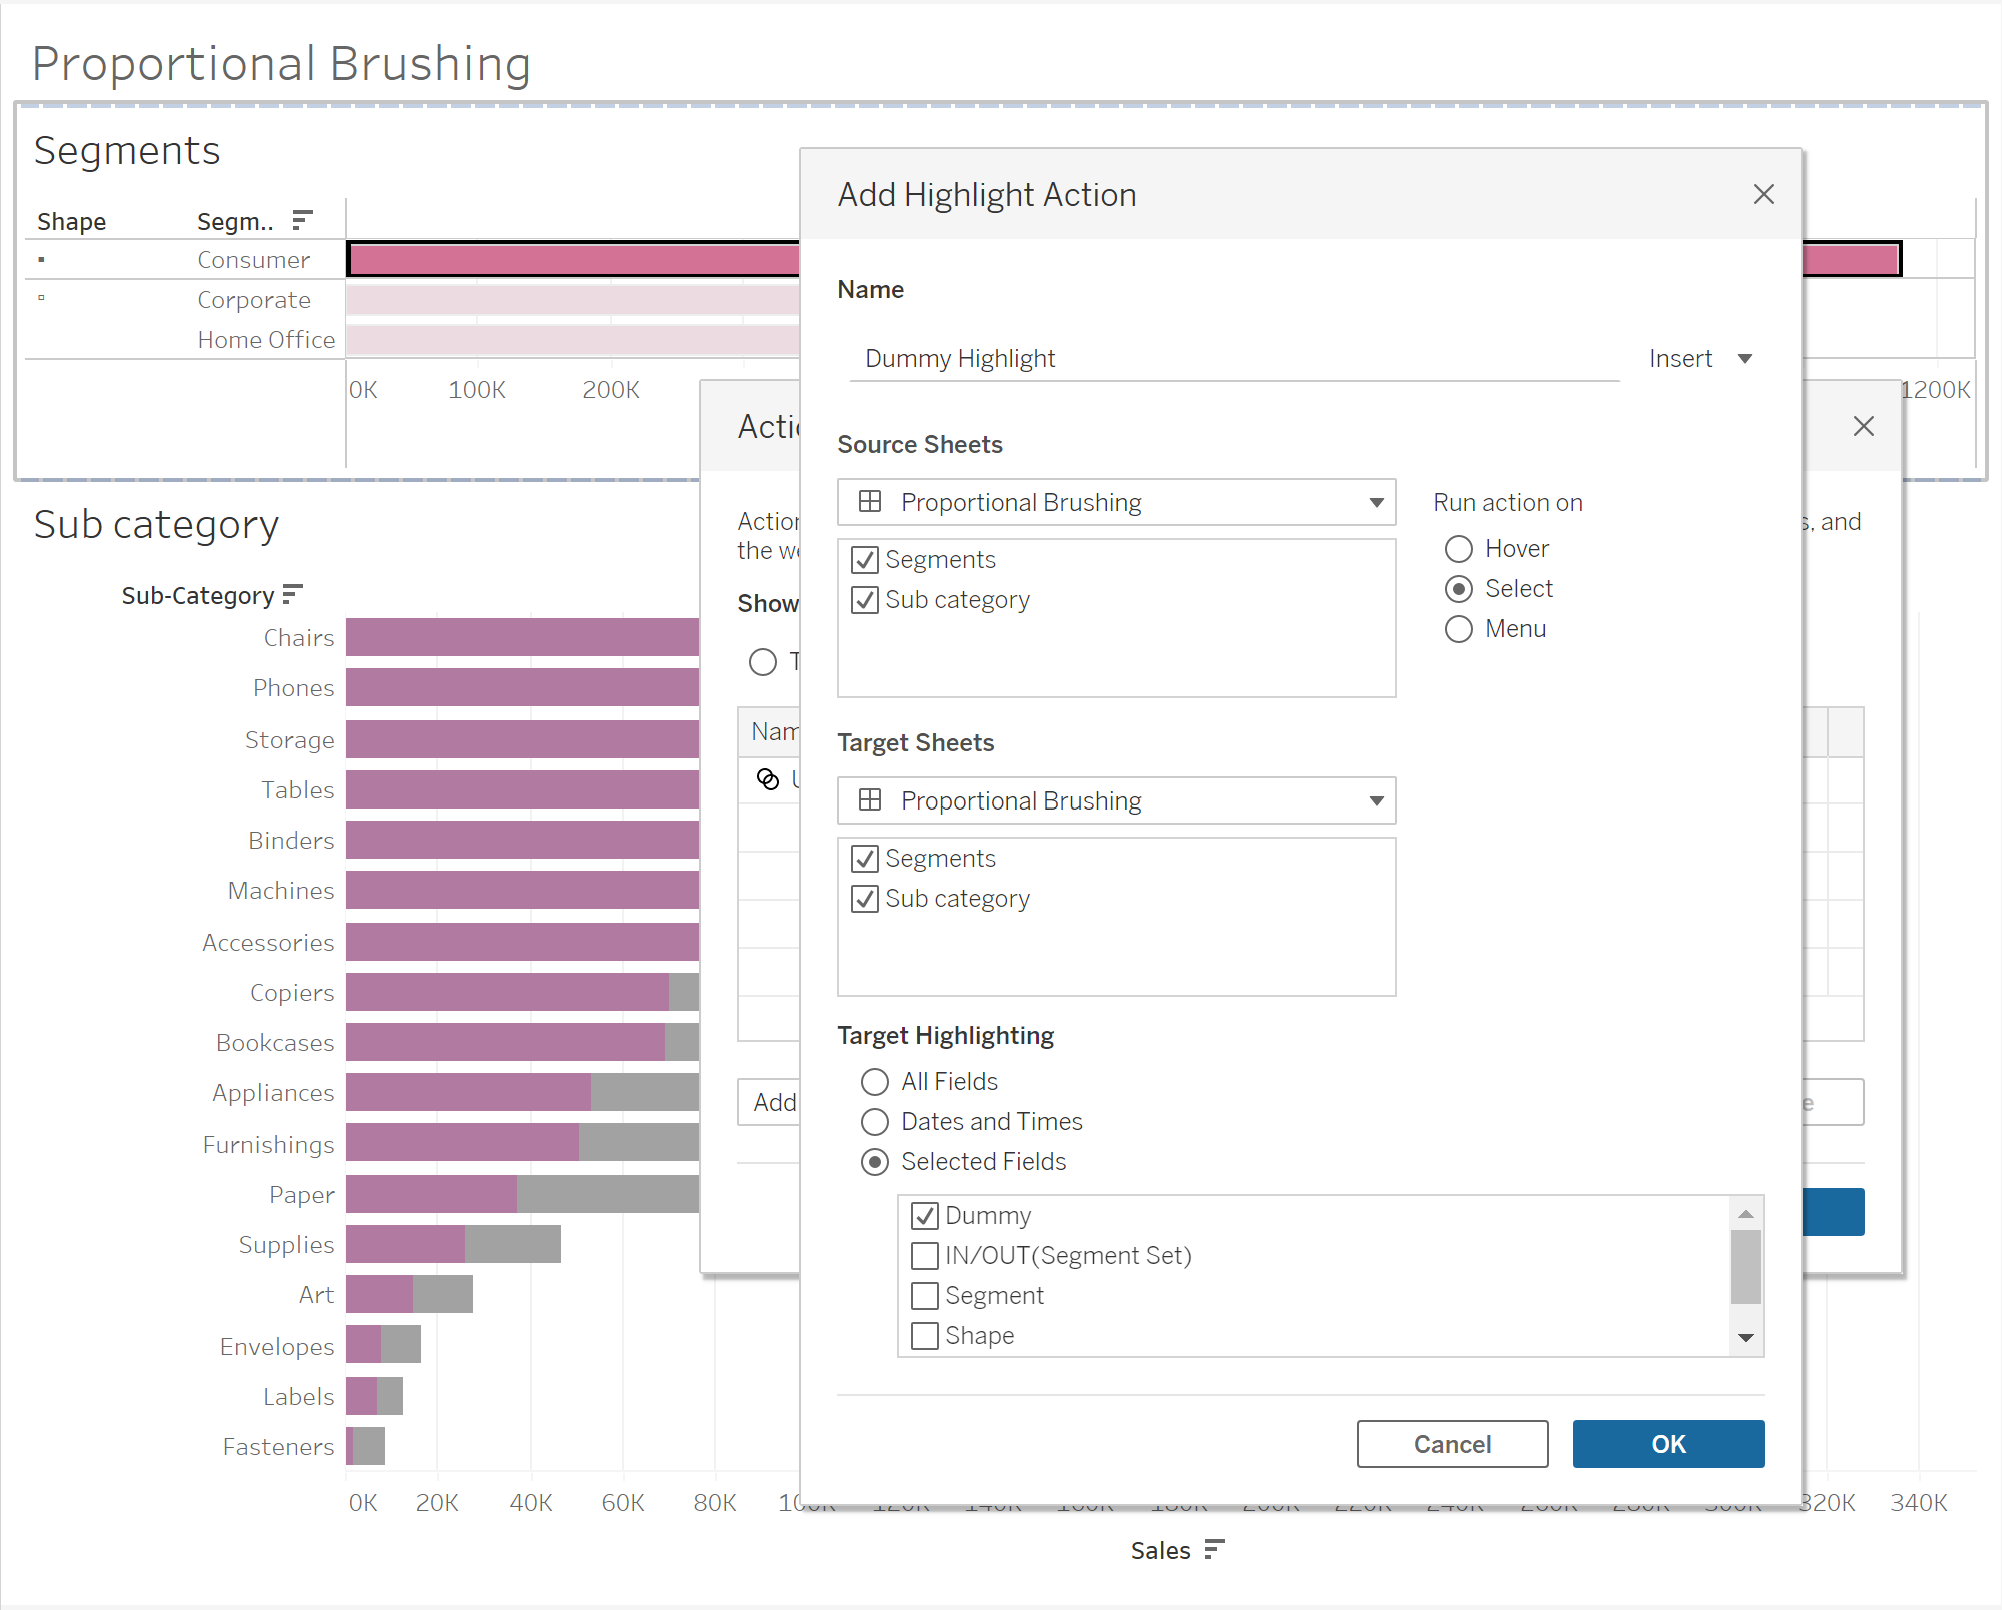
Finally, open your dashboard. Select Dashboard > Actions from the toolbar. Create a new highlight action. Your source sheet needs to be the relevant dashboard and under 'Target Highlighting', select Selected Fields and choose your dummy field.
Now you can select to your heart's content without losing any detail.