This will be a small guide into the spatial functions in the calculated field of Tableau. Spatial functions are useful for when working with data that has latitude and longitude coordinates. This blog will hone in on these six spatial functions.
Must Have
As a general note, for these spatial functions to work it is necessary for your dataset to have latitude and longitude coordinates.
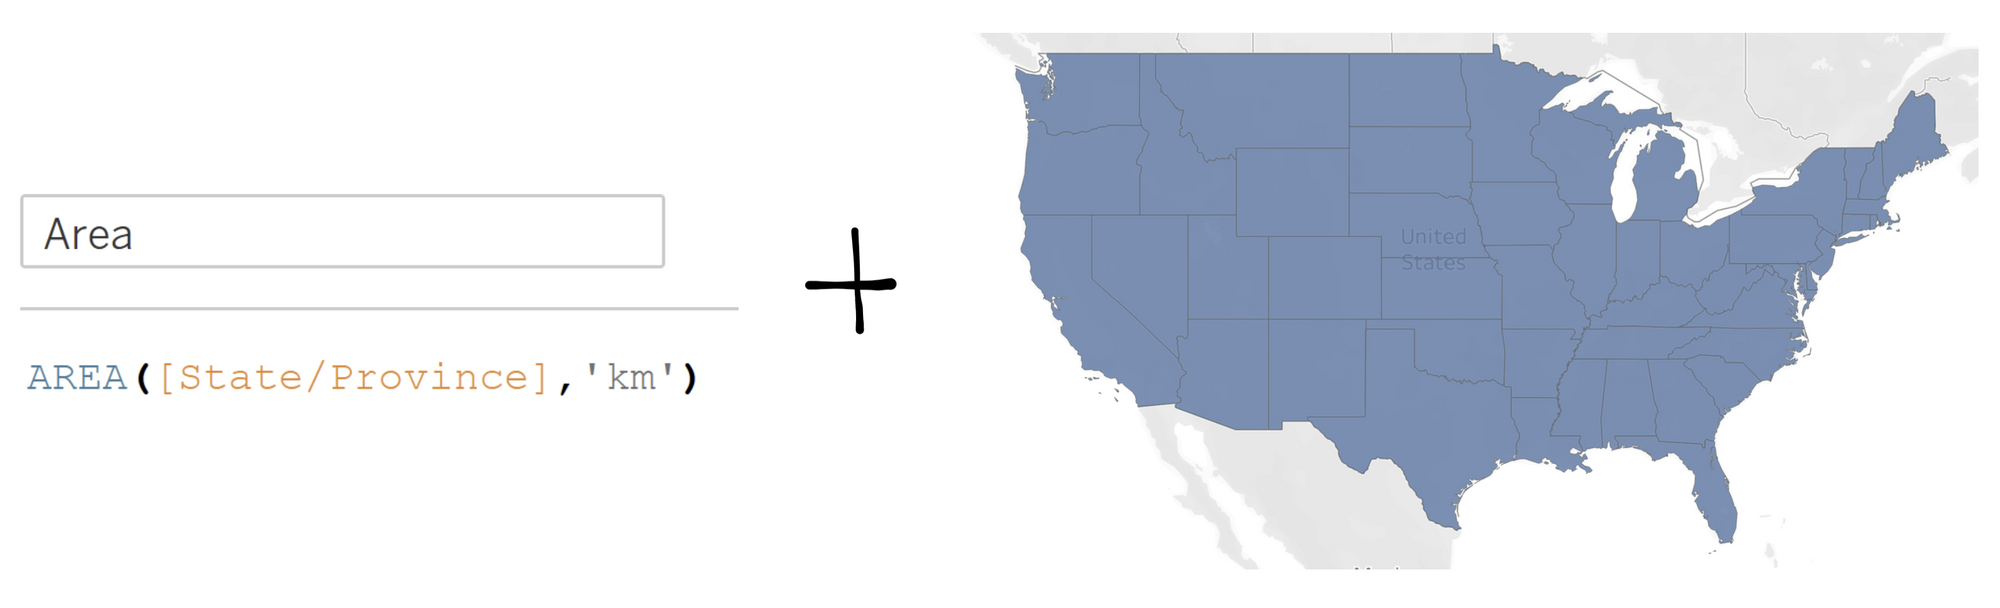
Area
The area function simply calculates the surface area of the polygon shape of the data. For example the area of the states of US. This will then calculate the area for each state in kilometres squared. You can change the measurement to squared miles, just change from 'km' to 'mi'.
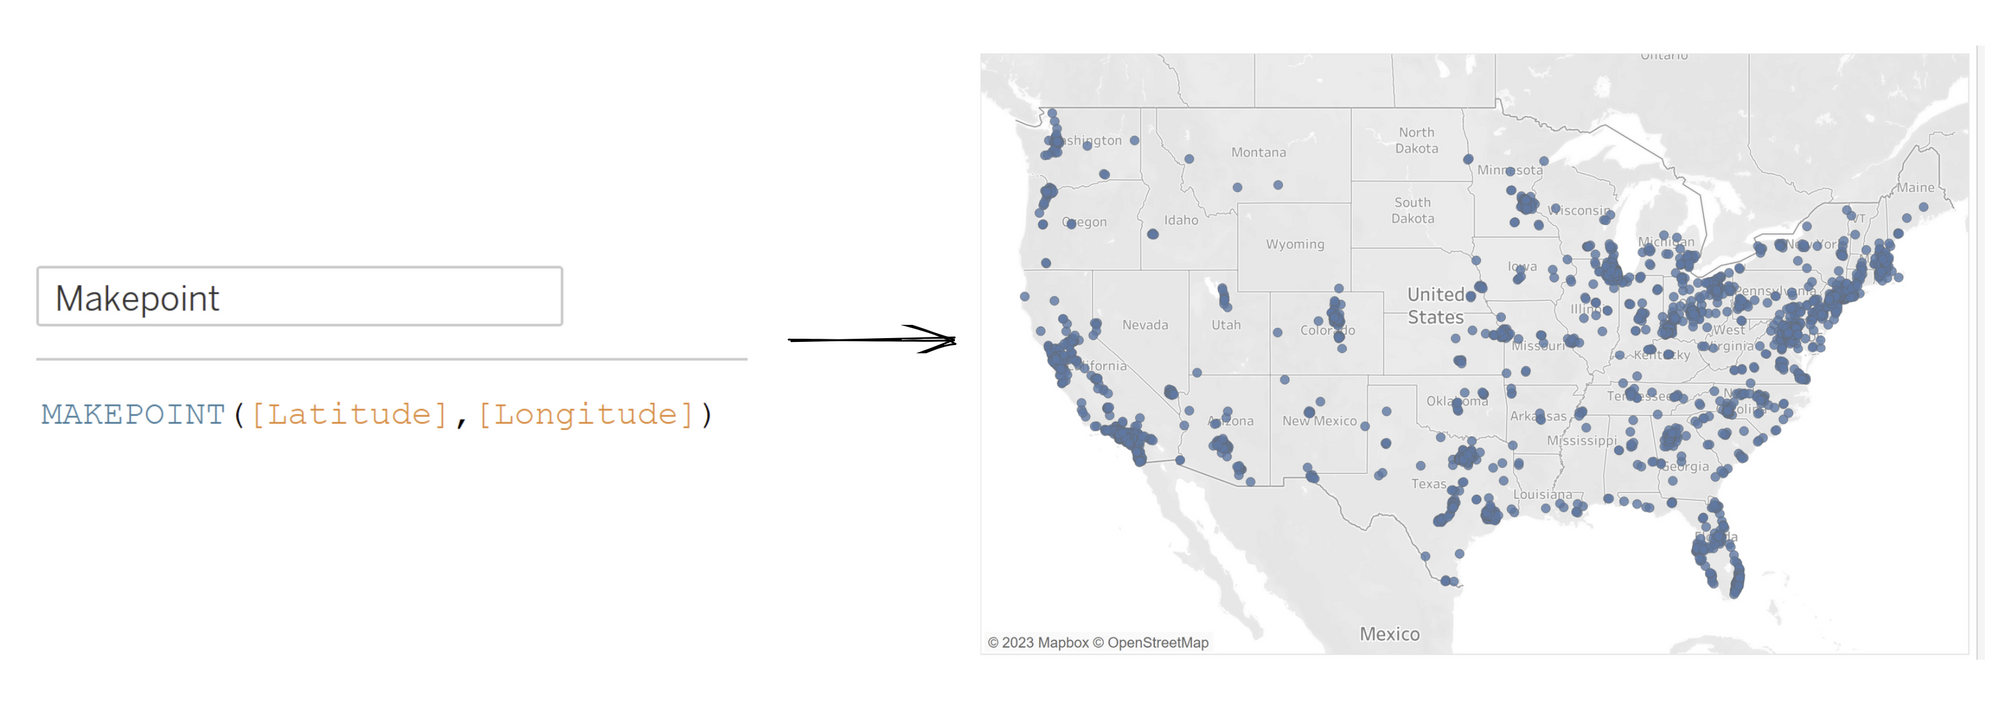
Makepoint
I'll start with makepoint first since all the other functions (except area) pretty much build upon this function. What this function is does simply transform your latitude and longitude coordinates into a spatial point on a map. So for example lets use this dataset using chipotle locations. Now using the makepoint as shown below using the latitude and longitude coordinates, the following map should be as shown. All of the chipotle locations are now points based from their latitude and longitude coordinates.
Distance
Now with your makepoints constructed, the distance function simply calculates the distance between two points. For example I've chosen these random two locations.
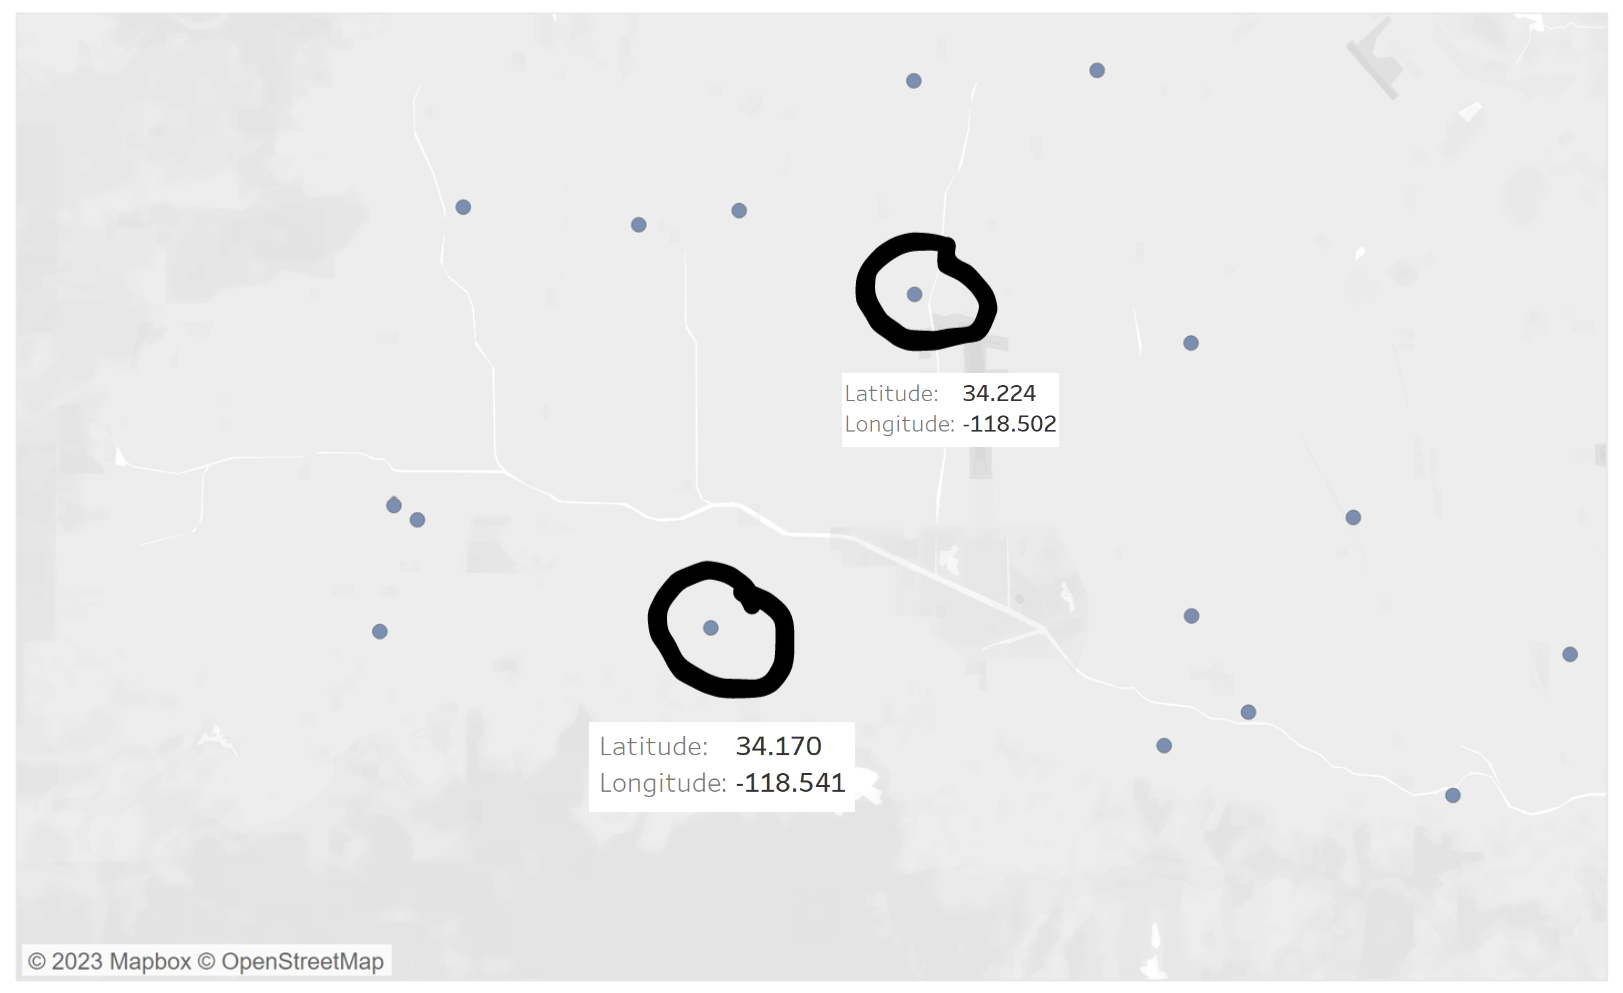
Use the syntax format as below but replace with your desired coordinates, which should then show the distance between these two in the tooltips. You can also change from km to miles through 'mi' instead.
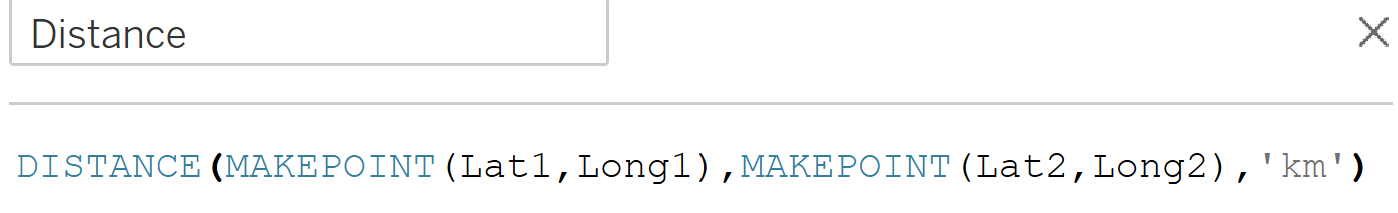
Makeline
Building on from makepoint, this function simply generates a line mark between two points. It can be used for creating origin-destination maps. Create the calculated field using the syntax below, replacing with your own coordinates for the points and drag it to to the marks layer. It should then show similar as to the figure on the right.
A good application of the makeline function is this dashboard visualizing flightpaths here.
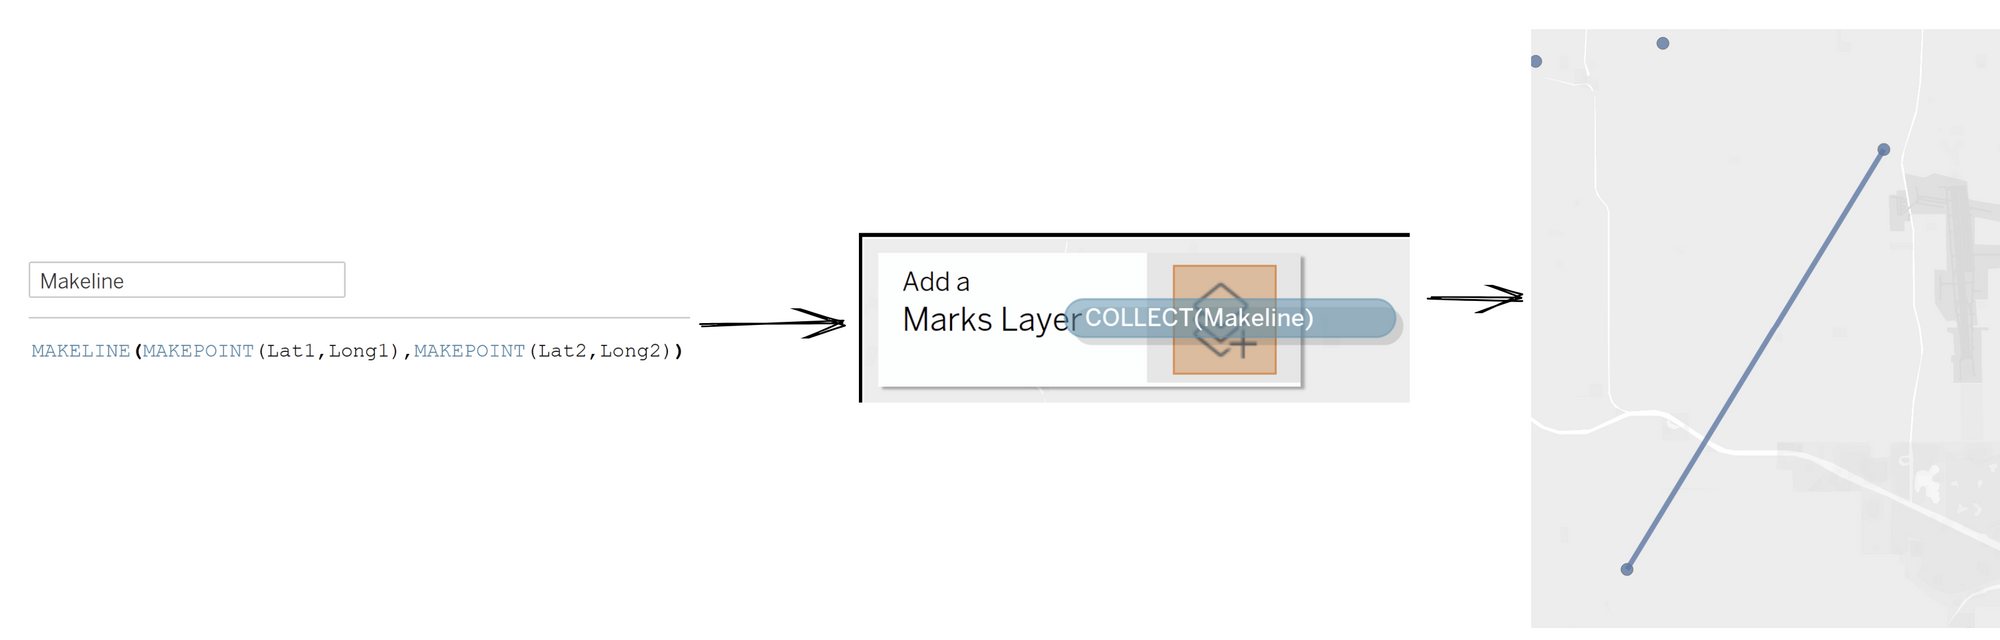
Buffer
A buffer simply puts a radius around a specific point of your choosing. Using the syntax below and dragging it into add marks layer, you should have a radius circle as shown.
Again, you can change 10 to whatever number or size you want as well as measurement unit you want.
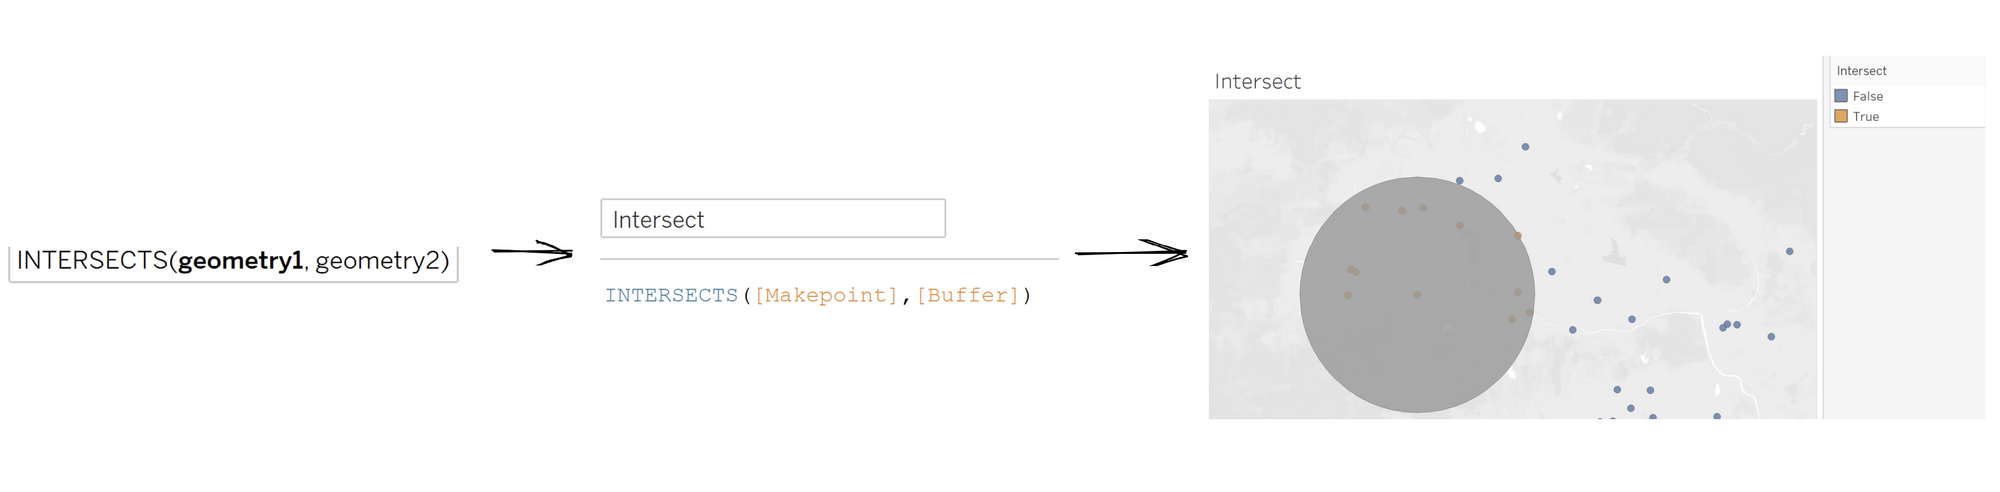
Intersect
An intersect follows on from the buffer function. If another location is within the buffer of a point, then it is returned as a Boolean statement as 'true' meaning that this location is this close from the origin of the buffer point. Otherwise 'false' is the locations falling outside of this radius. The makepoints and buffer were already created throughout this blog so they fill for geometry and geometry 2. As you can see, locations outside the buffer radius are returned as false and locations within are returned as true.