When working as a Data Consultant, documenting your work is an extremely crucial part of your work, but also a part that is often treaded and undervalued. This article will break down why we need to document our work, best practices how to do that, and show you plenty of examples how this could look like.
Why do we document our work?
1.) It makes it easier for other people to take over our work.
As data consultants we will get to a point where other people will take over our work and we are turning to new projects. Hence, it is crucial to make sure that this transitions is as smooth and easy as possible. The more documentation, comments, and annotations you have, the easier it is for anyone taking over your work to understand your thought process, your analytical work, and why you implemented certain features over others.
But even before you pass on your work, documentation facilitates collaboration within the team your working in and adds to transparency.
2.) You can remember what you did months ago
When working on many different projects at the same time, maybe even across different software, you will forget why you did certain things in the past, what a certain tool in Alteryx does, or how you built a complex chart in Tableau. Annotating your workflows, adding comments to your workbooks, or keeping a change log can help you remember how and why you did all of that, which will save you time in the future.
3.) Summarize important calculations or data observations.
Especially when you have a lot of calculations and observations about your data (e.g. where you found data inconsistencies), you may want to keep all of these thoughts in one place for easier access. This will also enable you to use the search function, e.g. if you are looking for a particular calculation.
How do we document our work and what types of work documentation are there?
- Alteryx/Tableau Prep Workflow Annotations
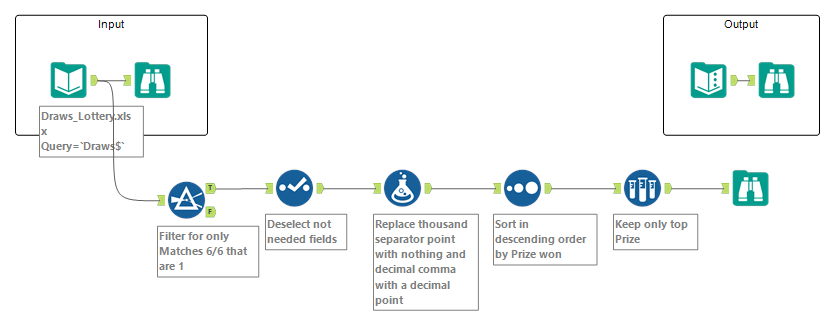
These annotation are extremely helpful when it comes to describing your thought process, why you used certain data cleaning steps, and how they transform your data. In Alteryx you can add direct annotations or text boxes with longer explanations. In Tableau Prep, you can add titles and descriptions. See some examples below:


- Tableau Workbook Captions/Descriptions/Titles etc.
In Tableau you have multiple options to add documentation. You can add a caption to your worksheets. If you do not see captions in your Tableau, click on Worksheet in the top menu bar and then tick Captions. Then you simply click into the caption textbox and add whatever documentation/annotation you think is helpful.
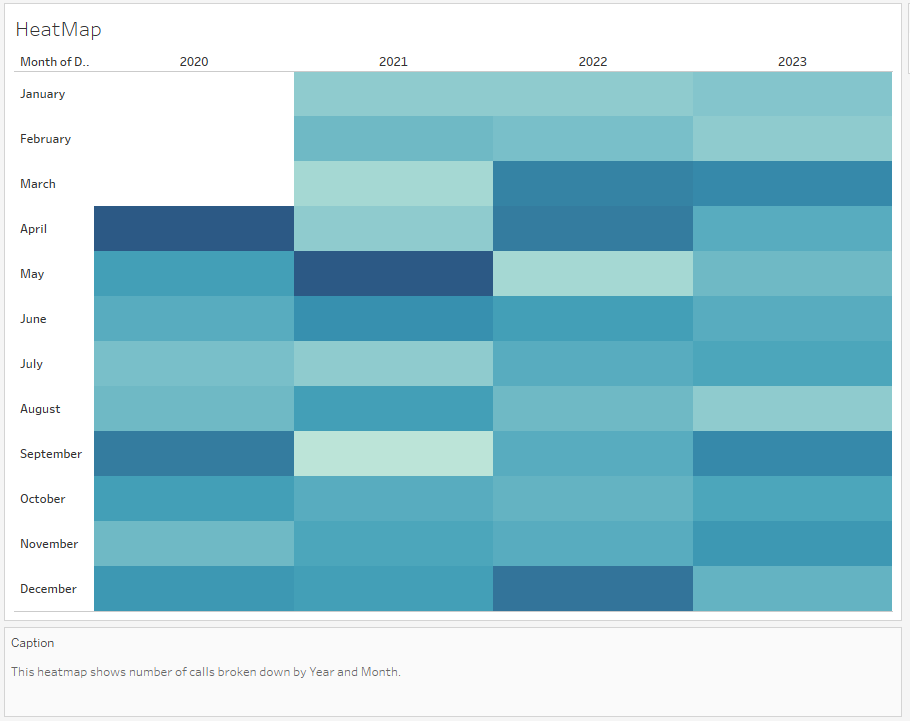
You can also add comments into Calculated Fields to explain calculation steps or summarize what that calculation does. Remember to add two forward slashes // before your comments to not include it in your calculation.

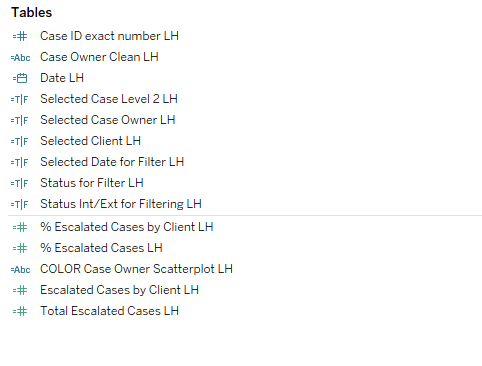
Another way to document your work in Tableau is to use the titles of Calculated Fields. I like to use certain keywords such as FILTER, COLOR, or LEGEND if that calculated field is mainly used for those functions. I also add my initials to Calculated Fields that I create. Once I hand over my work, the stakeholder then knows who created those calculations and can reach out should there be any issues or questions.
- Data Dictionaries/Calculation Guides
If something like this does not exist for your client company, you may want to create a Data Dictionary that describes the different columns/variables, their meaning, and potentially how they are calculated. If if does exist, you want to make sure that you update it with any new calculations or columns you create. You can also create a guide with all calculations, their titles, how they are calculated, and any important notes to consider (e.g. whether to use SUM or AVG or MEDIAN).
- Change Log
In some scenarios it may be useful to keep a change log. This is particular useful if you take on an existing dashboard and you want to keep a log of all the major changes. This can help to understand your thought process, but also to easily reverse one or multiple changes. Plus, it documents all the work you put into a certain project over time.
- Documentation Guides
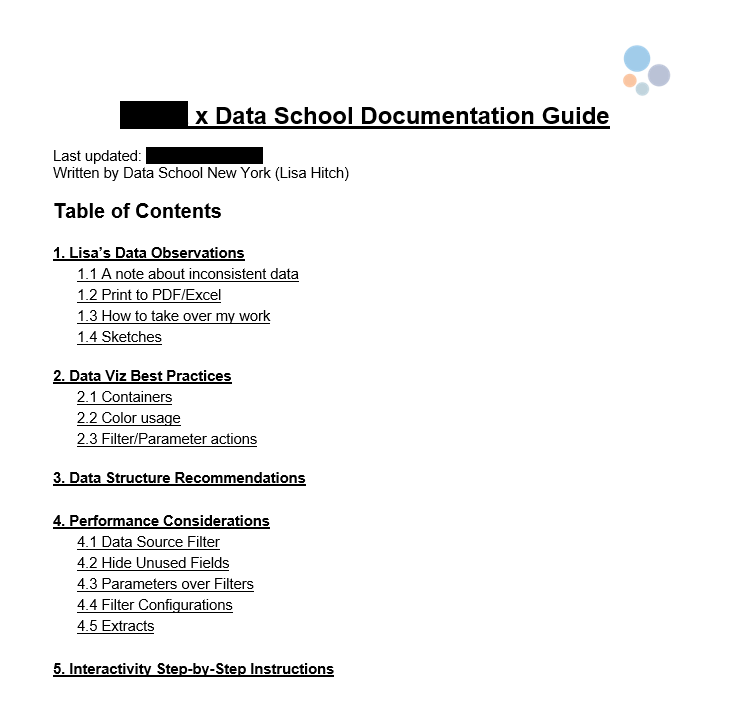
My favorite is a Word Document with a Table of Contents that acts a Documentation Guide. You can add any sections that you think are important to the stakeholder. For one of my recent clients I created a 20-page Documentation Guide with data inconsistencies I observed, data viz best practice recommendations, data cleaning/re-shaping recommendations, and step-by-step instructions including screenshots how I implemented a complicated interactivity feature. But these sections were specific to my project. Whatever you think is important for your stakeholder, can be included here. You can also include additional resources, links to workbooks on Servers, or screenshots.
Below you can see a slightly modified version of the the table of contents for the documentation guide I created for my stakeholder.
How to handover files to your stakeholder?
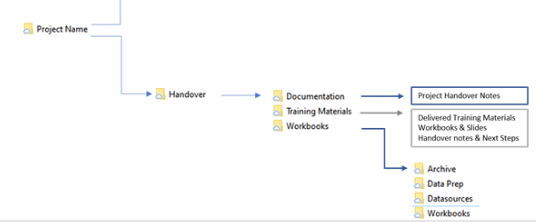
Make sure that you clean up all your files (including titles!) when handing over your work, maybe even put them into a new folder called "Handover" and share them through a secure location with your stakeholder (e.g. a password-protected Fileshare). See below for an example how you can organize your folder structure. Most importantly, only include final versions, and only documents that the stakeholder really needs. For example, the stakeholder may not need your own private notes from throughout the project. But it may make sense to include the data source or instructions on how to retrieve the data source, even if you send over packaged workflow or workbooks.
With these tools it's now nearly fun to document your work, right? :)
Did you enjoy this article? Give me a follow on LinkedIn and let me know what you thought!
All screenshots were taken by Lisa Hitch in Word, Alteryx Designer 2023.1, and Tableau Desktop 2023.3.
