


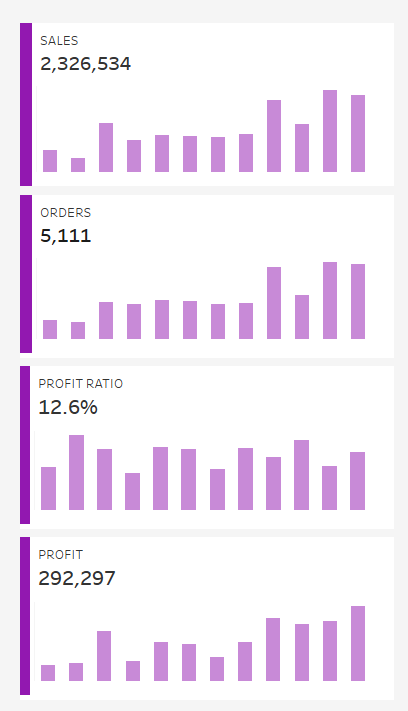
Business Dashboards have the intention to convey key metrics quickly to the user or stakeholder, which is why a lot of business dashboards use little sections (so-called "cards") to highlight those key metrics and how they are trending. Under the key metric you often find a small version of a graph over time (also called spark line or spark bars) and ideally a second number that gives some context on how the key metric changed compared to the previous month, quarter, or year.
Here are a few example of KPI cards:
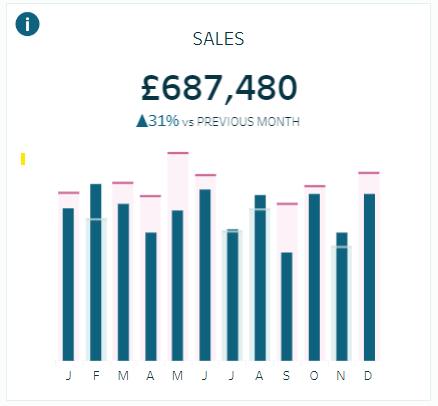
Example 1 (designed by Valerija Kirjackaja)
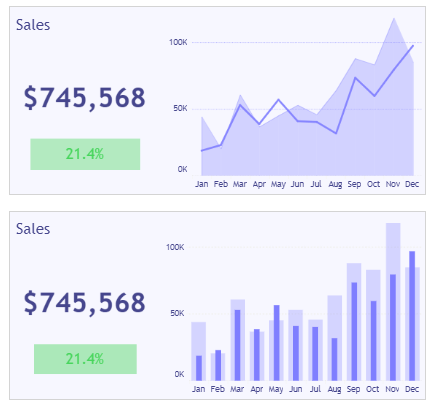
Example 2 (designed by Idris Akilapa & Gbolahan Adebayo):
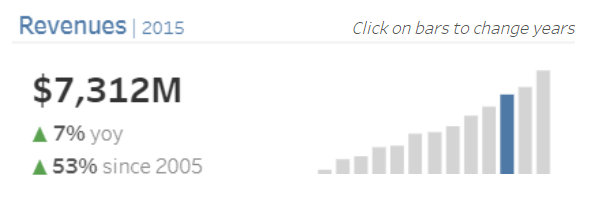
Example 3 (designed by Spencer Baucke):
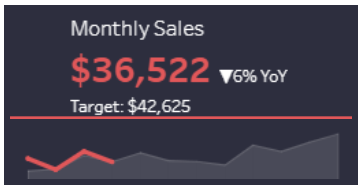
Example 4 (designed by Luke Stanke):
The Workout Wednesday (2022 W19) challenges you to format a nice looking business dashboard, including KPI cards in the following format:
I, personally, love the style of those KPI cards with the purple stripe on the left, the bars in a slightly lighter purple, and the white cards in front of the grey background. I would maybe add some context by adding a smaller number and arrow that indicates the growth compared to the previous time period.
I had seen KPI cards like this before, but I never knew how to format them the right way with containers in Tableau.
So here are my step-by-step instructions (this is based on Superstore data):
1. Floating vertical container: In most cases, when I start a new dashboard, I first drag a floating vertical container into the view and change its position to X=0 and Y =0 and its size to the exact size of my dashboard. This is the only time I use a floating container and this will be my "master container" where everything else will go in. I also change the background color to a very light grey. I then simply drag a blank into that container.
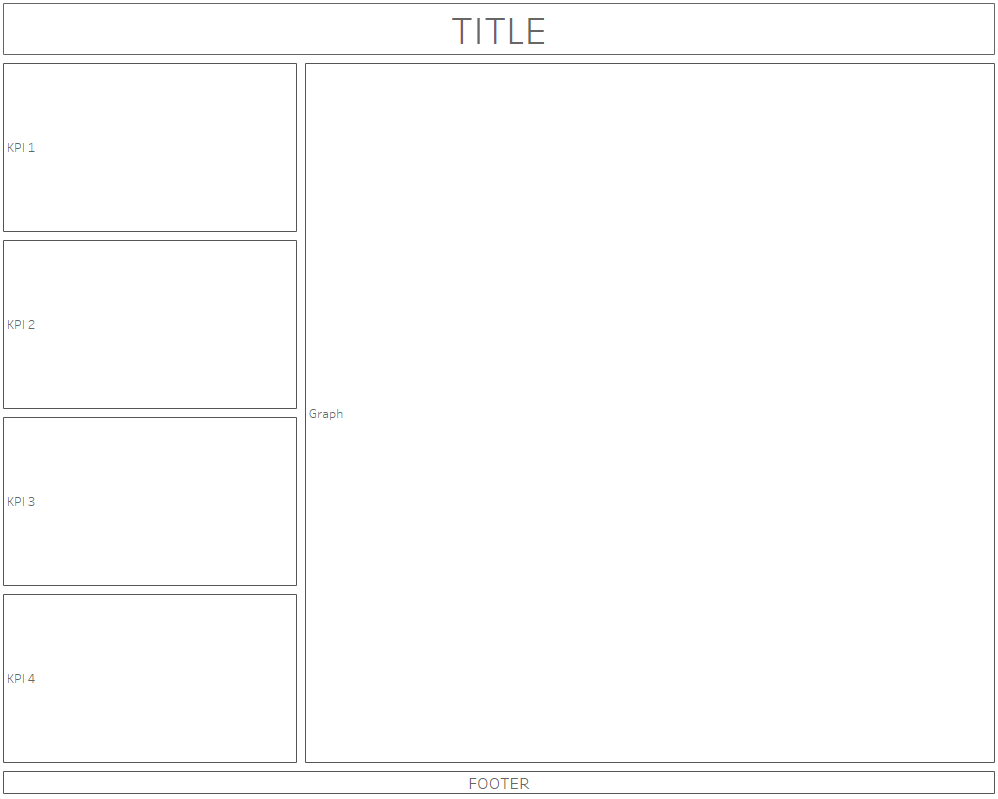
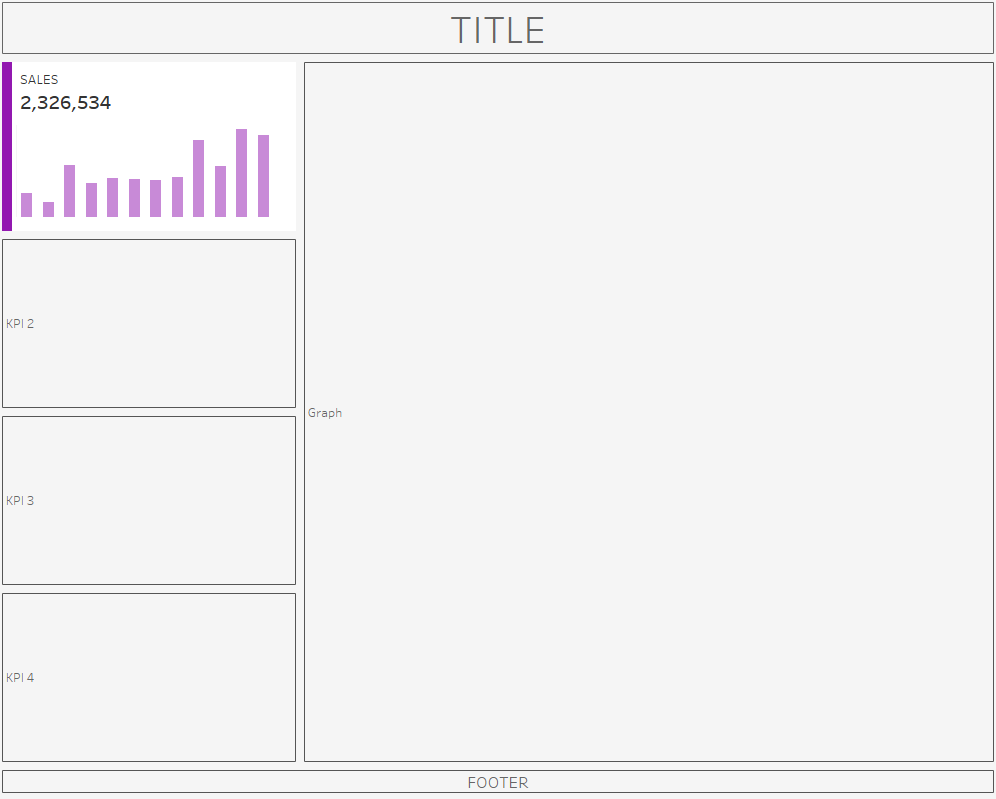
2. Adding the layout of my dashboard: In this case, I want a title and a footer (two text boxes) and then one box in the middle that is split into two boxes horizontally (the left side will be for my KPIs, the right side can contain a bigger graph or table). The left side will be again divided vertically into 4 pieces for my 4 KPI cards.
So, to start, I will drag 2 textboxes and a horizontal container in my view. Then I add two more textboxes to my horizontal container labeled KPIs and Graph. I then drag a vertical container between these two text boxes and add 4 text boxes to it labeled KPI 1, KPI 2 and so on (you can then delete the textbox that was previously labeled KPIs). These are all just placeholders for now. My dashboard layout looks like this:
In case this was confusing in writing, here is a short video how I created the placeholders:
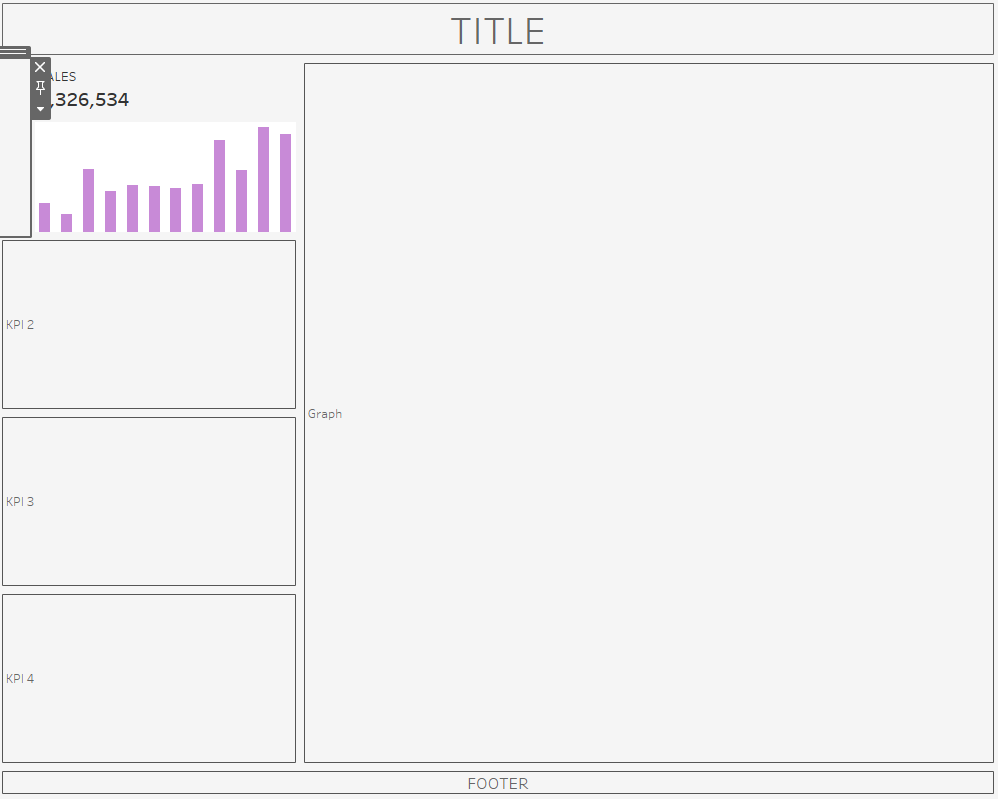
3. Adding the first KPI card: For the first KPI card we need 2 elements: Our worksheet with the bars and the sum of sales in title (note, you can also create two different worksheets: one with the sum of sales and one with the bars) and a blank container with a purple background that will act as our stripe on the left.
So, first, I will add a horizontal container under my KPI 1 placeholder and add my bar chart and a blank to it and resize it accordingly. I can also delete my placeholder that says "KPI 1".
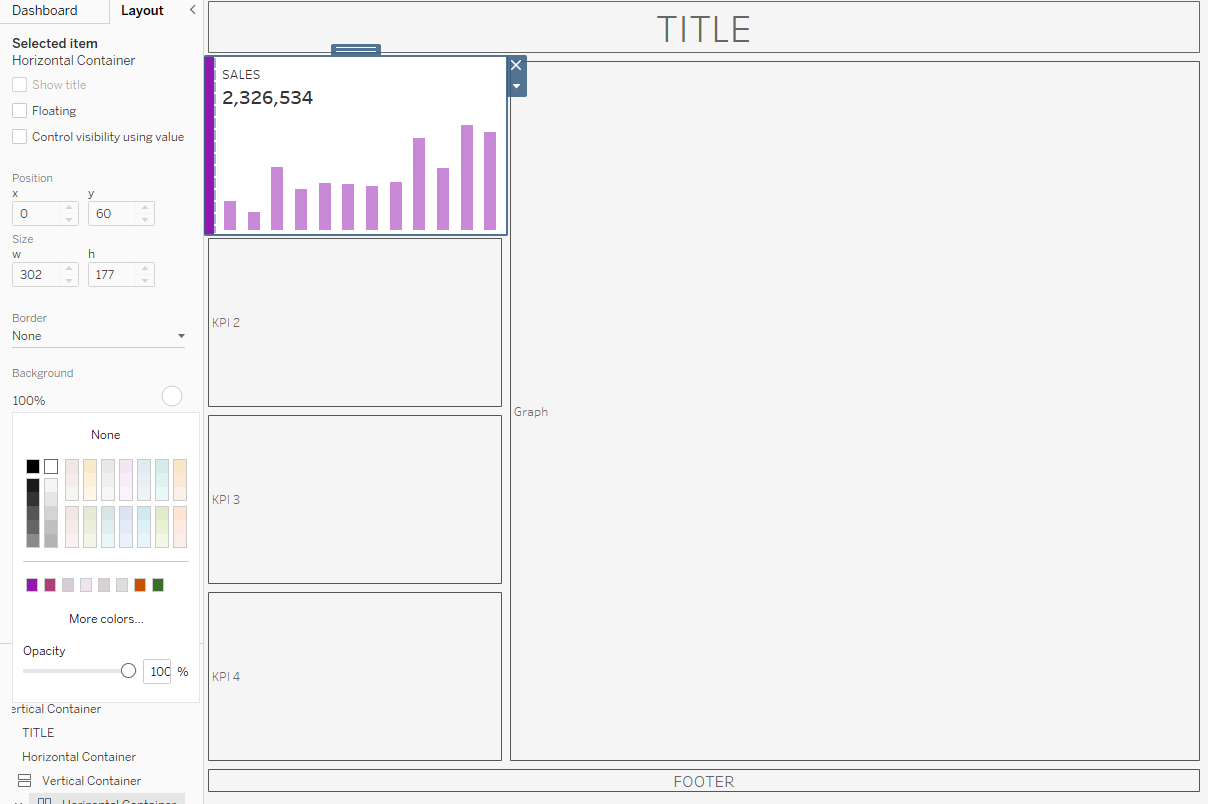
4. Format the purple stripe: To get my purple stripe, I click on the blank container that is left of my bar chart, navigate to Layout on the left, change any padding to 0, and choose my background color. I then click on the little arrow next to the blank container and choose "Edit width..." and set that to 10. Now it already looks like what I want, but the title is not on a white background and the stripe is squished to the left.
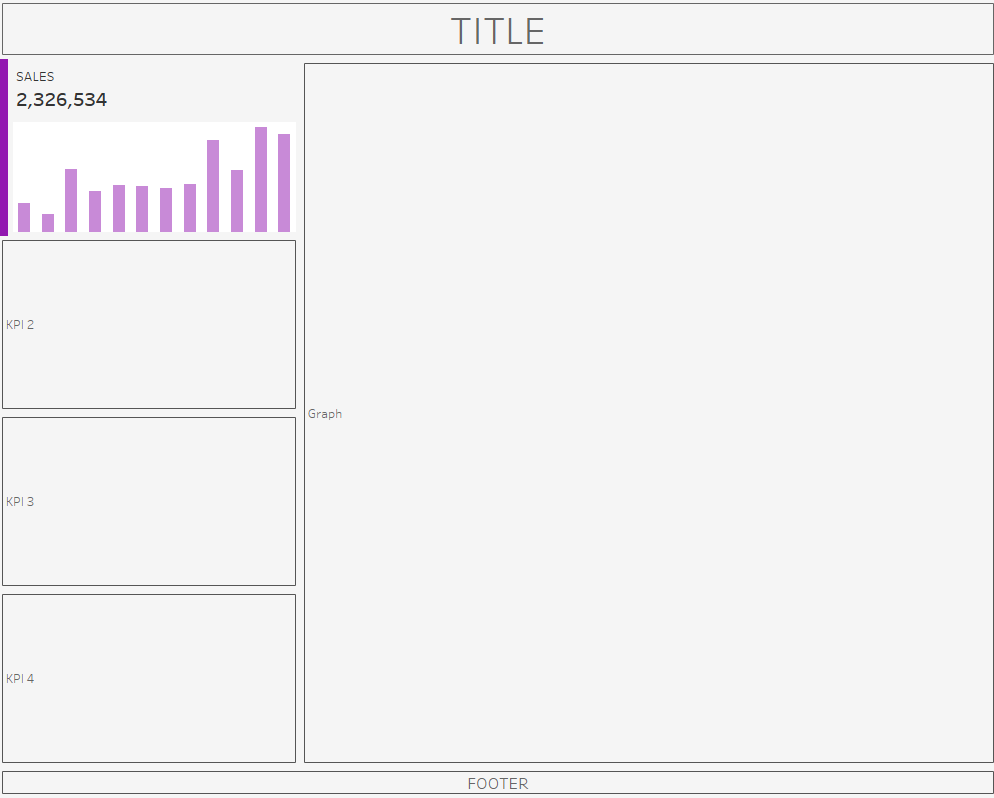
5. Adjust background color: To create a whole white KPI card, I double-click on the top of the grey container where my worksheet it in. When you double-click on it, it should turn blue. This means that you now have selected the horizontal container where both your stripe and your bar chart is in. Once you have that, navigate to Layout on the left and choose background color white.
6. Adjust formatting/padding: While we have the right colors now, the box is still wider than our other boxes and it looks a little out-of-place. Also, the bars inside the box are very close to the edges of the box, which makes it look squished. You would have to play around with how much padding you would like, but here is what I would do:
- The box that contains your bar chart: Outer padding 4 on all sides, inner padding 10 on right and bottom
- Blank that is your stripe: no inner or outer padding
- Horizontal container that contains both your bar chart and your stripe: Outer padding 4 on all sides, inner padding 8 on the right side.
7. Repeat Steps 3-6 for the other three KPI cards!
And that's it! That is one way how to format neatly looking KPI cards.
Feature Image based on screenshots by Lisa Hitch
Inspired by Workout Wednesday 2022 W19.
Screenshots and Video by Lisa Hitch, in Tableau Desktop 2023.1