Using Sample-Superstore data source I'm going to walk you through how to create a chart where if you select a category the other categories are compared to the selected one.
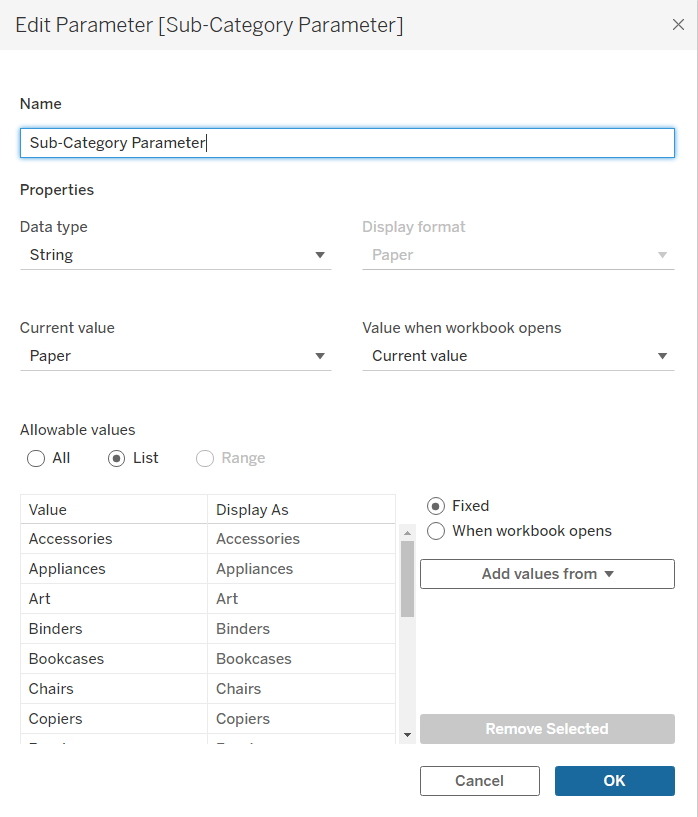
Step 1. Create a parameter based on the Sub-Category field.
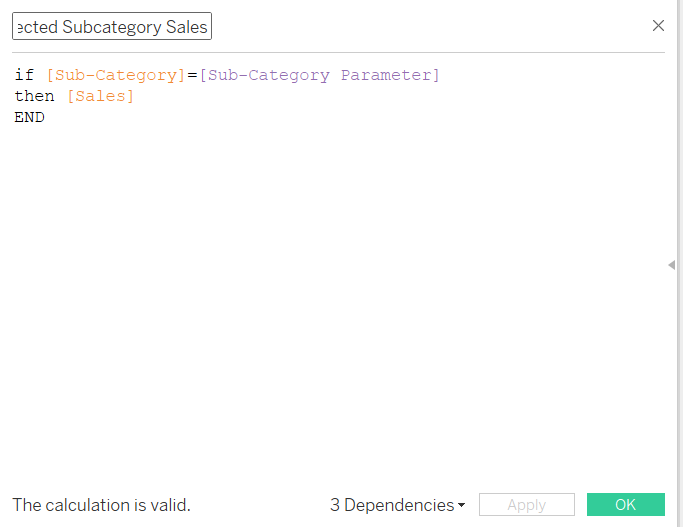
Step 2. Create a field to get the sales for the selected Sub-Category. ('Selected Subcategory Sales')
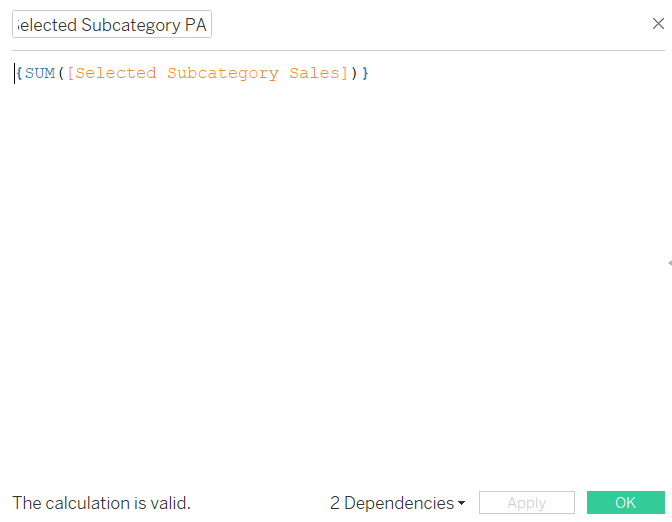
Step 3. Create a field to fix the total sales of the selected Sub-Category. ('Selected Subcategory PA')
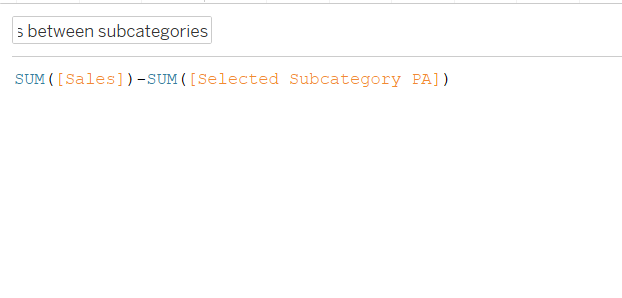
Step 4. Create a field that calculates the difference between the selected Sub-Category and the other Sub-Categories. ('Difference of sales between subcategories')
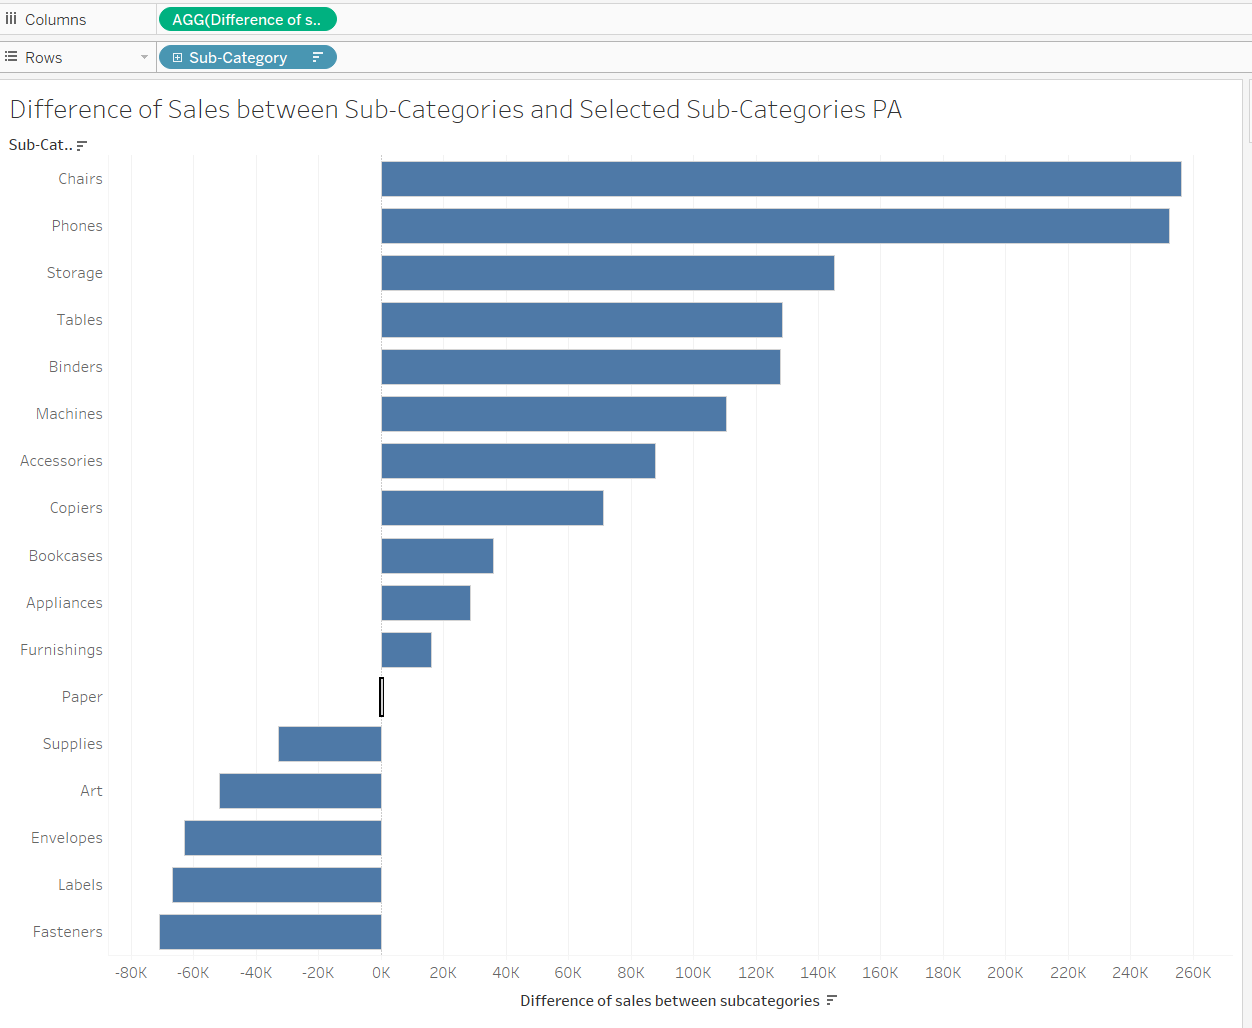
Step 5. Put Sub-Categories on Rows, 'Difference of sales between subcategories' on columns.
Step 6. Set up the parameter action that allows the selection of Sub-Categories.

Voila: