Last week at the Data School I discovered 3 different ways to calculate Current Year (CY) and Prior Year (PY), allowing you to compare the current performance of your chosen metric to the year before.
I learnt about these methods from watching demonstrations from 3 different TIL staff members; Andy Kriebel, Lorna Brown and Oliver Clarke. As a result, I will refer to them by the name of each respective person.
Okay, let's get into it!
Lorna's Method (Youtube Link)
First of all, Right-Click on the Order Date field (I am using Superstore data) and drag this pill onto the Columns shelf.
A menu should appear, and you should select Discrete YEAR (the blue YEAR date, usually the third option from the top).
Next, place Sales (or your chosen metric) on Text in the Marks Card.
Already we can see the CY and PY values we want to use, in my case, 2020 and 2019.
We also want to find the difference between these two values, so next we drag a new Sales pill onto Detail. We then Right-Click on the pill and select the Percent Difference table calculation.
This can be done from the Quick Table Calculation menu very easily, and in this scenario we want to Compute Using either Order Date or Table (across).
Once that's set up, drag that pill from Detail and onto Text. This should hopefully now show a new percentage value underneath each of your yearly Sales values.
We're almost there! But there is a little trick we need to isolate the CY we're interested in, and remove/hide the others.
Let's create a Calculated Field!

If you've understood most the caption above, then that's great! We want to use this calculated Field to filter out all the values other than the CY (our Last Year in the view).
So, drag this onto the Filter Shelf and the Filter dialog box should open. Tick the TRUE box and click OK.
I will save the formatting for the end of this post, but apart from that, we now have the information that we need for our BAN!
Ollie's Method
This method requires 4 calculated Fields.
So let's begin!

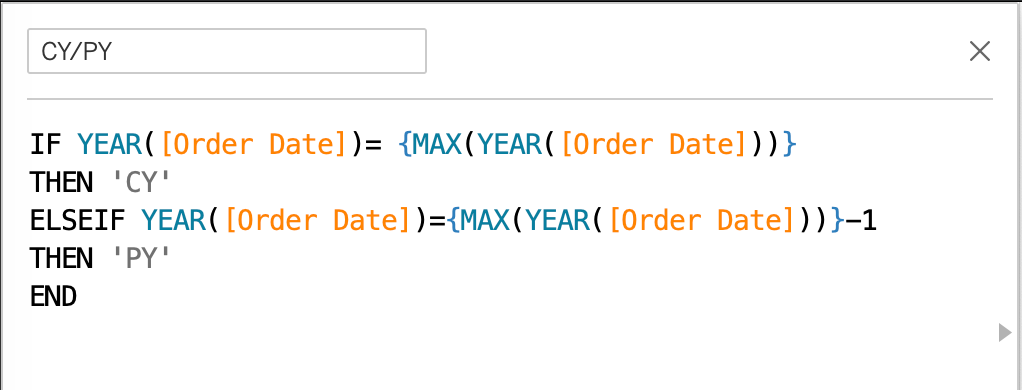
Let's discuss the logic of this first calculation.
The first part of the IF STATEMENT is looking at the YEAR part of each Order Date (in each row) and if that is the same as the Maximum year across those dates (the most recent year, therefore CY). If this is the case, then it's CY.
The second part is doing the same thing, except we have added -1 after the MAX YEAR so that we can look one year before our current year (PY).
Now that we've created this, we're aiming to create our CY Sales and PY Sales.


Now that we have both values, let's find the % difference.

Let's set the Default Number format for % difference before we put it in the view.
Right-Click on it in the Data Pane and go to Default Properties and then Number Format. For now, let's select Percentage and then change the number of Decimal Places to 1, then click OK.
Now drag CY onto Text on the Marks Card, and then drag % difference onto Text as well. We should now be at the same point as we got to with Lorna's method.
Andy's Method (Youtube Link)
Our last method uses LODs to fix the CY and PY values. This differs from the previous methods we've used, both of which can be broken up by a dimension to show us the CY Sales for each Category for example.
With Andy's method, the level of detail is determined within the calculated field and is unaffected by new dimensions added to the view.
This allows you to create a chart with this BAN as a title and the level of detail used in the chart won't affect the values.
We are going to create 3 calculated fields.


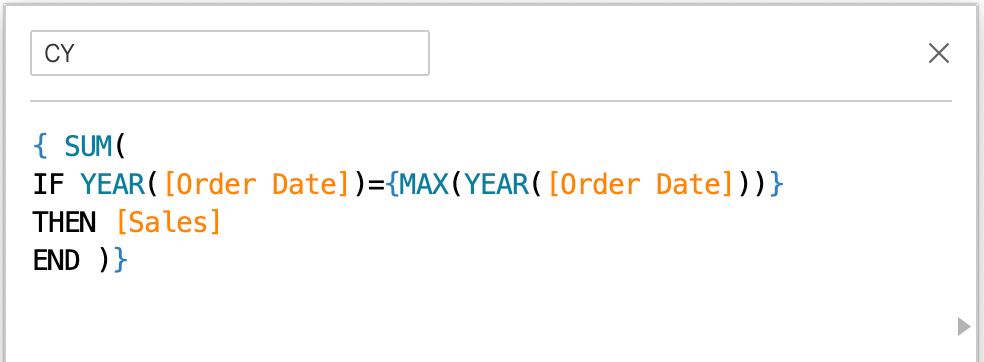
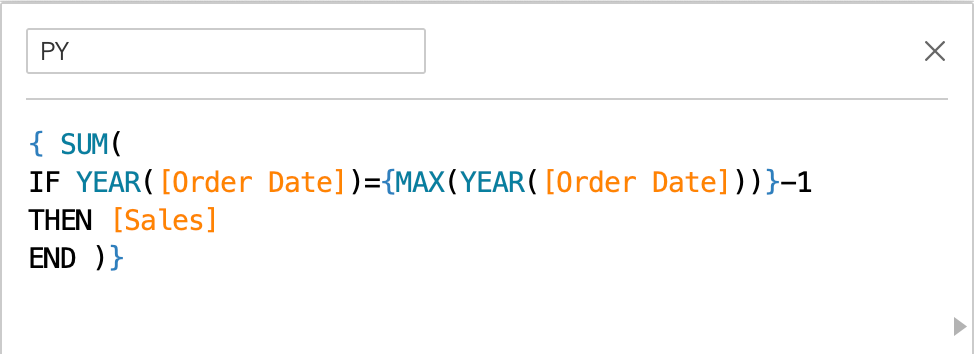
These calculated fields use the same logic we saw earlier in Ollie's method. The difference on this occasion is we are aggregating the whole calculation between the curly brackets; {}.
We are adding all of the rows that meet our Year criteria, so we are left with a total value for each of CY and PY.
Again we want to create a % difference, so let's do that equation again.

Let's set the Default Number format for % difference before we put it in the view.
Right-Click on it in the Data Pane and go to Default Properties ► Number Format. For now, let's select Percentage and then change the number of Decimal Places to 1, then click OK.
Now drag CY onto Text on the Marks Card, and then drag % difference onto Text as well.
The Final Stretch
What we have left now is some formatting.
Firstly, I will go to Default Properties ► Number Format for our CY pill. Select Currency (Custom) and put Decimal Places as 0 and choose you currency symbol of choice.
Next, I will go to my % difference using the same Default Properties ► Number Format. We could have done this earlier (but oh well!). At this point I am going to select the bottom option in the list, Custom. Most likely, at this point you should see 0.0% written in the box. We want to add an indicator for an increase or decrease in % difference. So let's insert +0.0%;-0.0% into our box, and then press OK. Arrows (▲▼) can be used interchangeable if you wish!
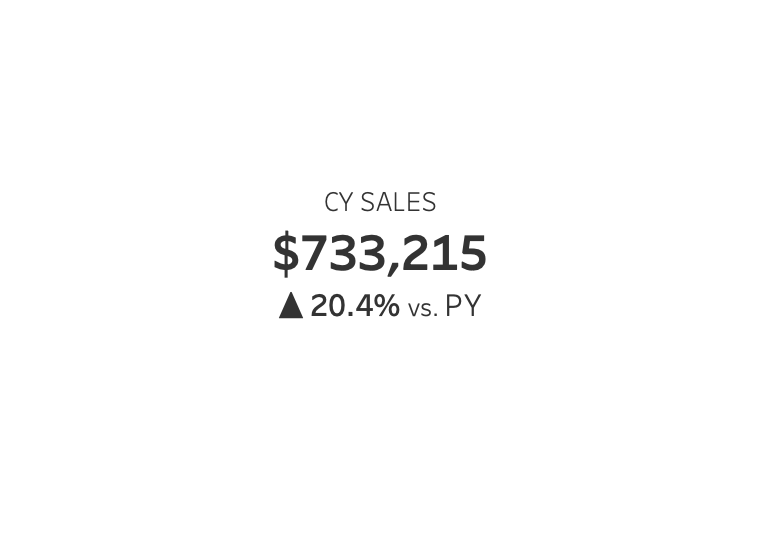
Click on Text in the Marks Card to edit the text. Then add a simple title, like CY Sales, above the values. I will then place my CY on a line above my % difference, make the size 18pt, change the font to Tableau Semibold. Arrange the formatting to your preference, however try and emphasise the CY BAN and contrast the other text to provide context.
Lastly, type vs. PY after the % difference value and press OK.
And that should be it!!

