


Data visualisation can be certainly seen as a mix of art and science. It blends elements of creativity and analytical precision. One then could say that the study of data visualisation is about how quickly and effectively information can be visually transmitted, such as the recipient can pick it up in an instant.
To achieve this goal, we take advantage of pre-attentive features - visual attributes or properties of objects which our brain process almost automatically and quickly. This could be colour, size, length, shape and motion, among others.
Here is a little example:
Can you tell which is the 4th largest value in the list below? You have 3 seconds to come up with the answer.
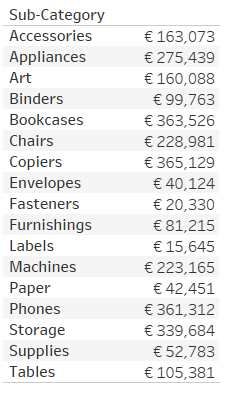
So? How did it go? If you got it… WOW! If you didn’t, what about now? (see below)
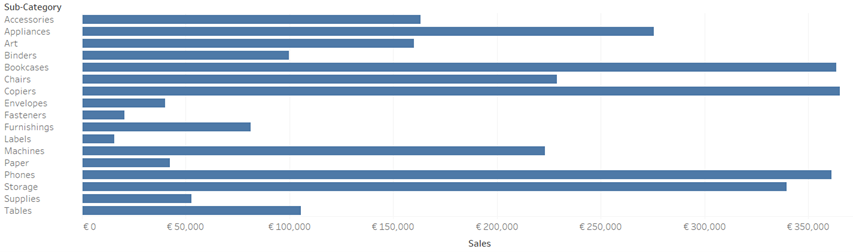
Surely you didn’t even need all 3 seconds to figure out that the wright answer is “Storage”, and that’s because our brain does a great job at processing information visually, comparing in this case the length of the bars with each other - Have I even ordered the bars from longest (up) to shortest (down), you would have found the answer almost automatically.
So, when creating visualisations, it is worth to always keep this concept in mind. The only caveat would be: Make use but don’t abuse. What I mean by that is this:
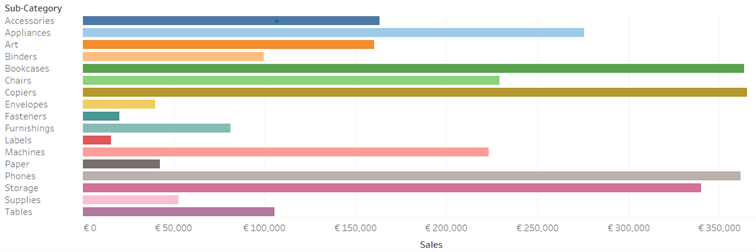
Differentiating categories by using colour may sometimes help you with the visualisations you create. However, in this case, it does not add any value to it. In fact, it confuses more than clarifies what you are trying to show or demonstrate.
To summarize it, using pre-attentive features in data visualisation helps us share information quickly and clearly. Visual elements like color, size, and shape can make our graphs and charts easy to understand at a glance. However, it's important not to incorporate fancy visuals that don't add value. The goal of data visualisation is to make information accessible and useful. So, let's use these visual tricks wisely to create impactful visualisations that speak for themselves and aid decision-making.