


Today tasks was some kind of a "Template Challenge". The idea was to build some resources for future work, as having a collection of templates under the sleeve can be useful when working on tight deadlines, require inspiration or when asked to showcase examples. Moreover, they save you time and stress, since you don't have to first figure out how to best put your vizzes together on the dashboard.
The goal was to design and create two basic templates; one for Tableau, and the other for PowerBI.
The templates needed to meet the following requirements:
- Title and Sub-Title Design: Specify font types and sizes.
- Spacing Guidelines: Define inner and outer padding for appropriate white space.
- Color Scheme Considerations: Ensure a cohesive color palette.
- Example Charts & KPIs: Provide ample scope for insight by adding context to KPIs with YTD/MTD comparisons and trending indicators.
- Well-Formatted Tooltips: Ensure they are contextually useful.
- Interactivity Examples: Include hover, click, and/or drillthrough features.
- Information Button: Add an image or a separate dashboard page outlining how to use the template.
- Footer: Include the designer's signature.
I was provided with two datasets and given the freedom to choose which one to use for each software. One dataset was the familiar Superstore dataset, while the other contained employee hiring and history data.
I chose the Superstore dataset for PowerBI and the following is a snapshot of what I built in the given timeframe:
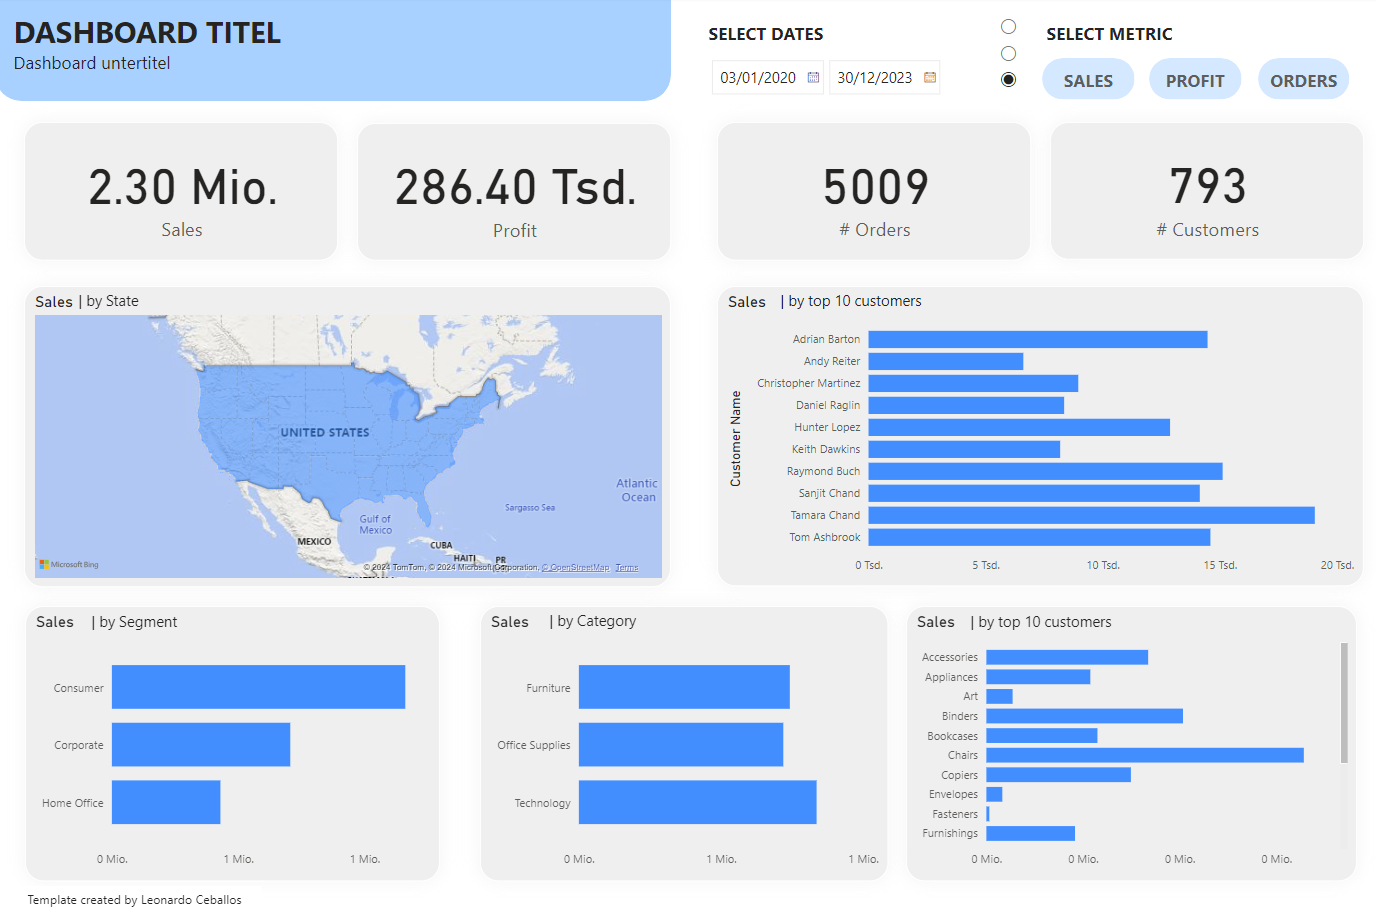
The dashboard contains actual visualisations like KPIs, a Map and Bar Charts that can be easily changed by the user as she/he sees fit.
Link to dashboard to be added
I used the Employee Hiring and History data to build the following Dashboard in Tableau:
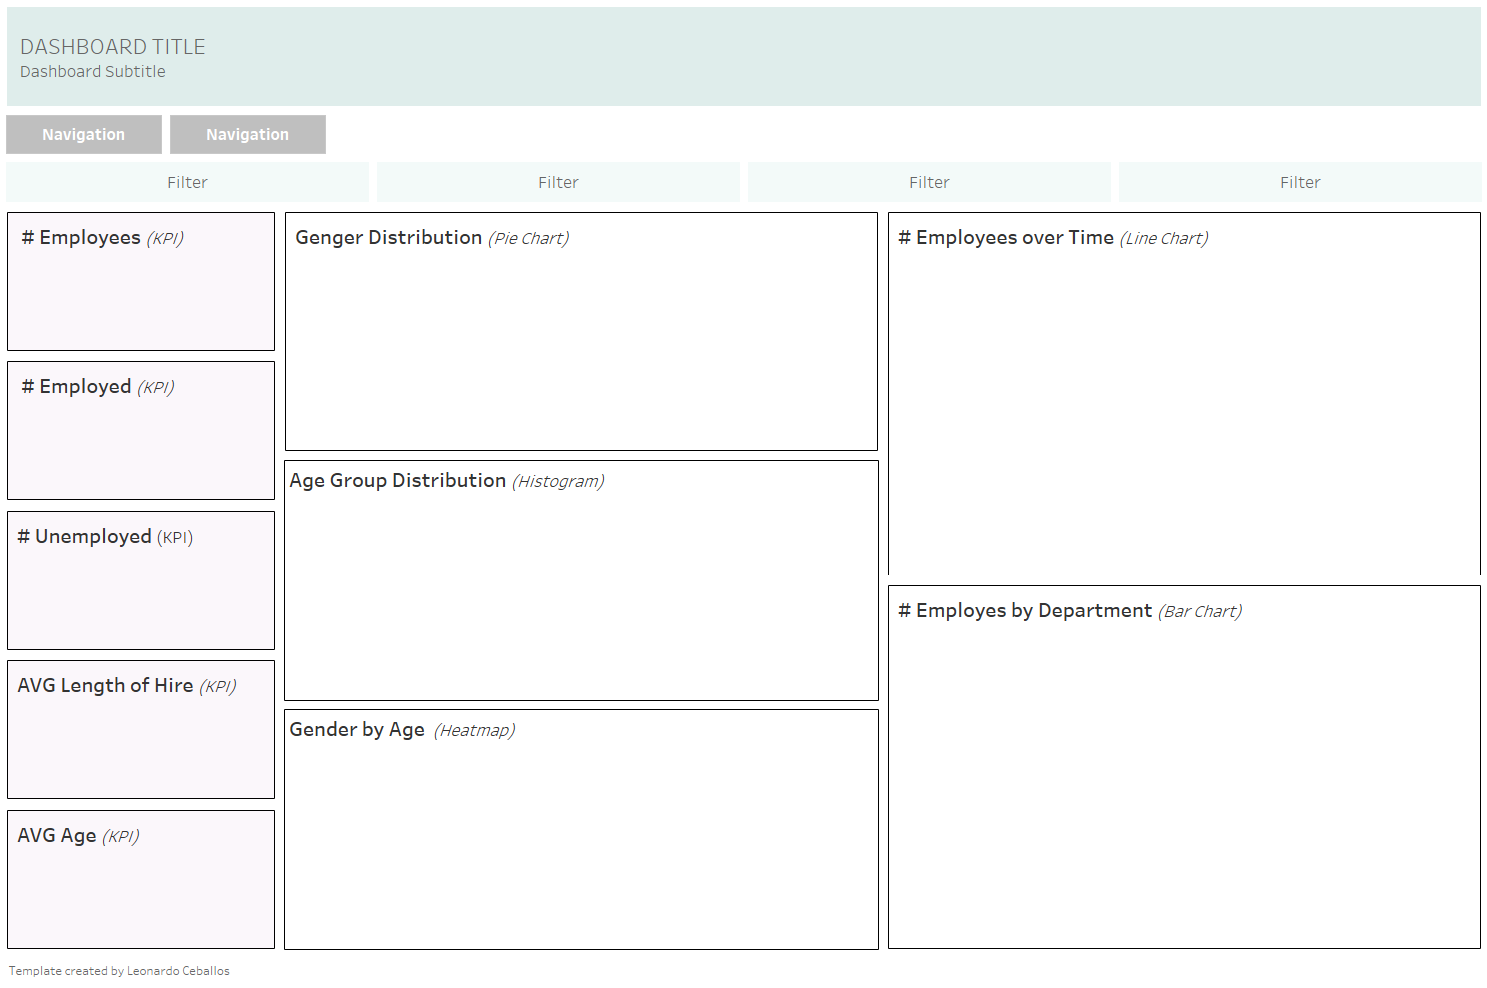
Due to time constraints, I focused on generating placeholders without actual visualizations. Human resources departments often use similar reporting models across various companies, regardless of industry or size. Using this template, users can examine KPIs such as the total number of employees in the company's history, active employees, employees who have left, average length of employment, and average age. Other charts aim to identify trends in gender and age distribution, employee growth over time, and the number of employees by department.