


In the project of week 2, DSNY 5 was assigned to build a dashboard with World Indicators dataset in Tableau. I would like to compare the Internet usage of each region and each country. Therefore, I chose to build a drill down bar chart for that case. Drill down bar chart could help me to compare the total Internet usage of each region, but the drill down bar chart could also let the user explores top countries in each region.
After building the drill down bar chart, my problem was too many countries in each region (Image Problem 1).
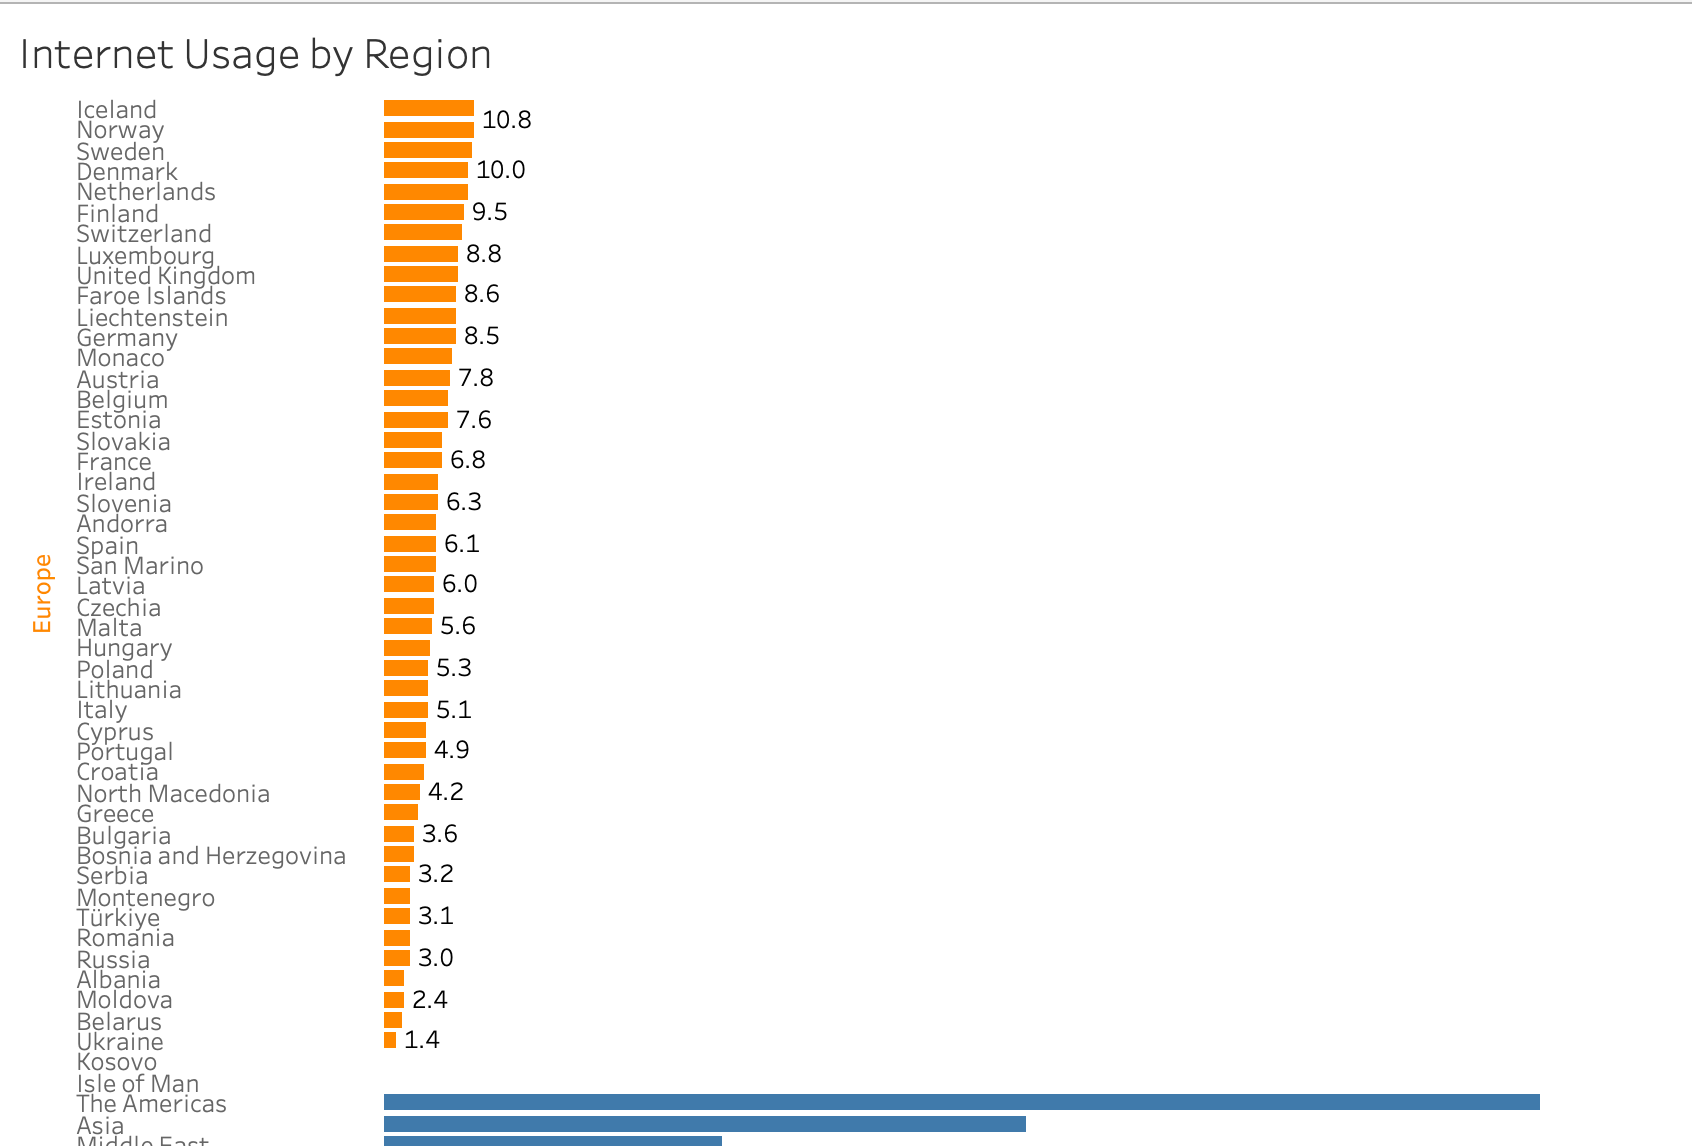
To solve my problem 1, my idea is creating a Country/ Region Set with the top N countries (parameter). Then, drag the Country/ Region set to Filter only "In" set. However, it leads to another problem that Tableau filtered top countries of All regions (Image Problem 2). In image 2, I chose top 7 countries, but it only shows Europe and Asia. If I chose 4, it only shows Europe region.
My goal at this time now are:
1/ Limit the number countries of each region
2/ The number of top countries could be adjusted by the user.
3/ Show the top N countries of each region (not top N countries of All regions)
I would say thank you to Valerija Kirjackaja, who helped me to solve the problem. I learned more about the Rank() function and understand how Table Calculations in Tableau is helpful in this case.
In the next section, I only show how Rank() function and Table Calculations help to solve my problems. You can take a look at the instruction how to build a drill down bar chart on Youtube by Andy Kriebel, who is also a Global Head Coach at The Information Lab.
Now, let's explore how to solve the problem.
After following the instruction how to build the drill down bar chart, I will get the result as the image below:
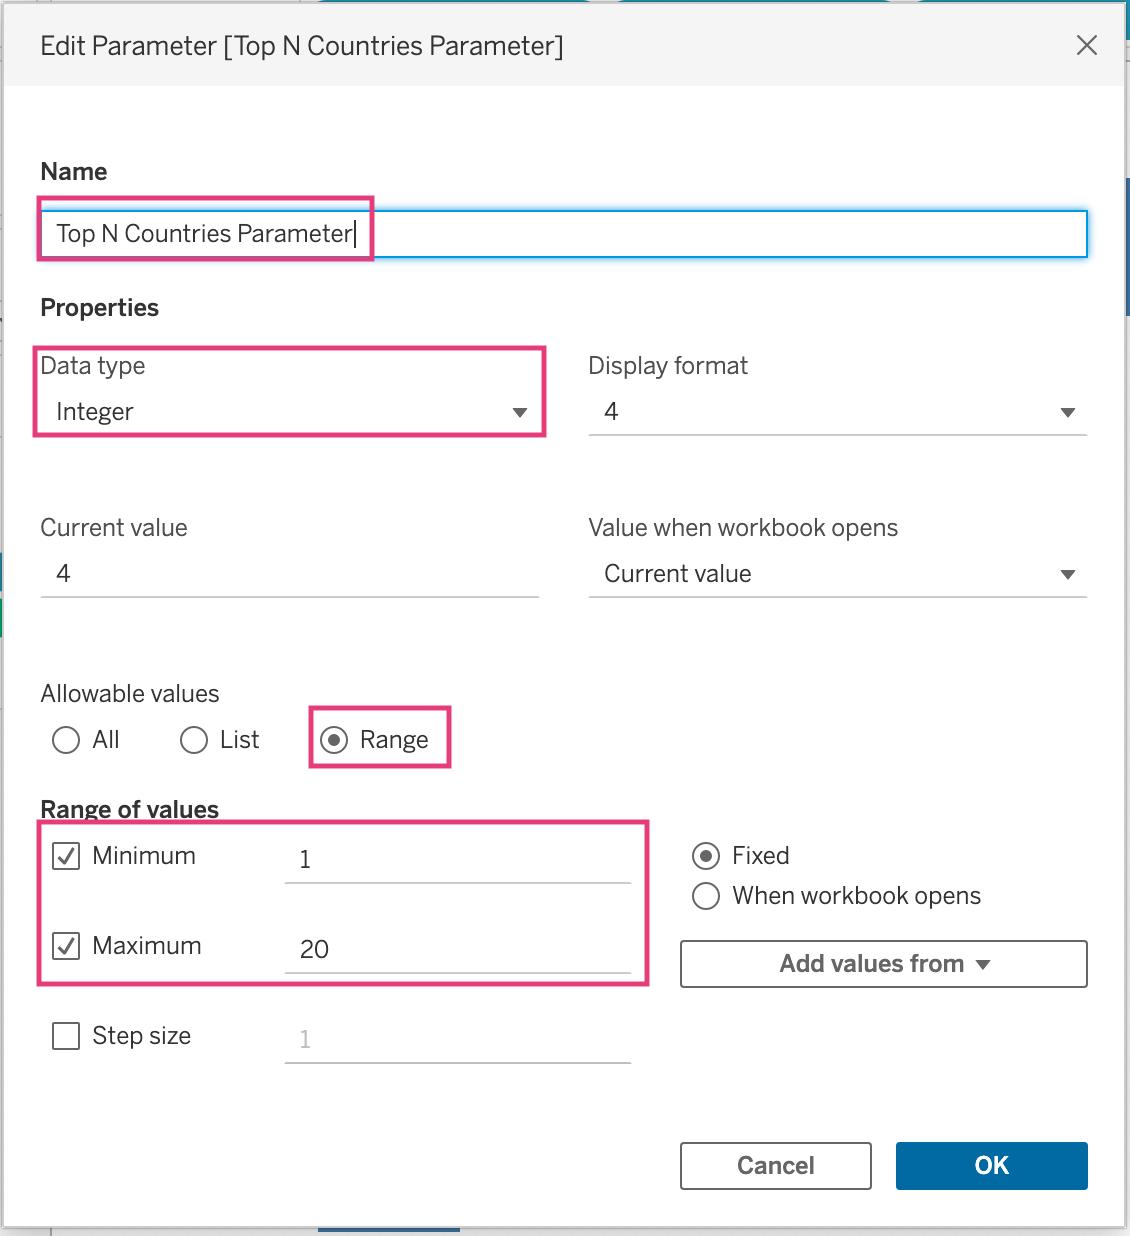
Step 1: I need to create a Top N Countries parameter to adjust the number of top countries about Internet Usage for each region. Data Type is Integer value with the range from 1 to 20.
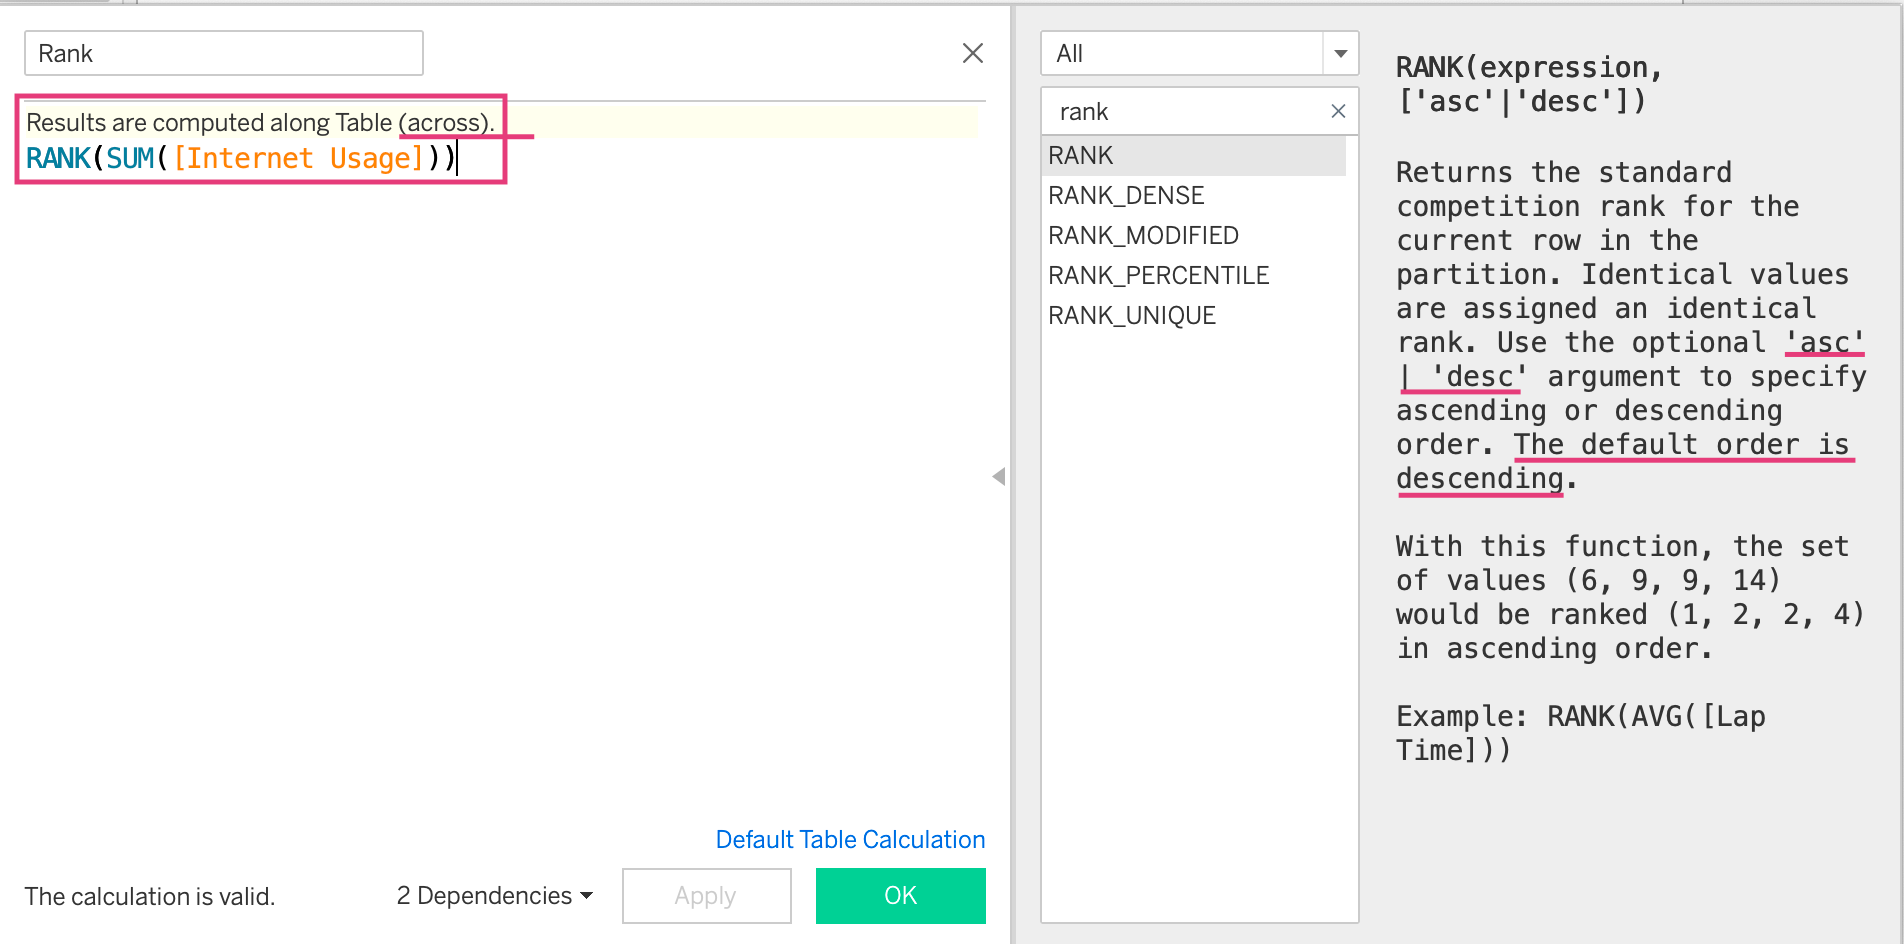
Step 2: Create a Calculated Field to rank the value of each row. Each row represents the SUM of Internet Usage value of each country/ region. The formular is RANK(SUM([Internet Usage])). The default order for that formular is Descending order because I would like to get the top values on the head. The result will show in Table (across).
It means that Table Calculations will calculate the rank from the top to the bottom rows. The highest values are in the top, the lowest values are at the bottom.
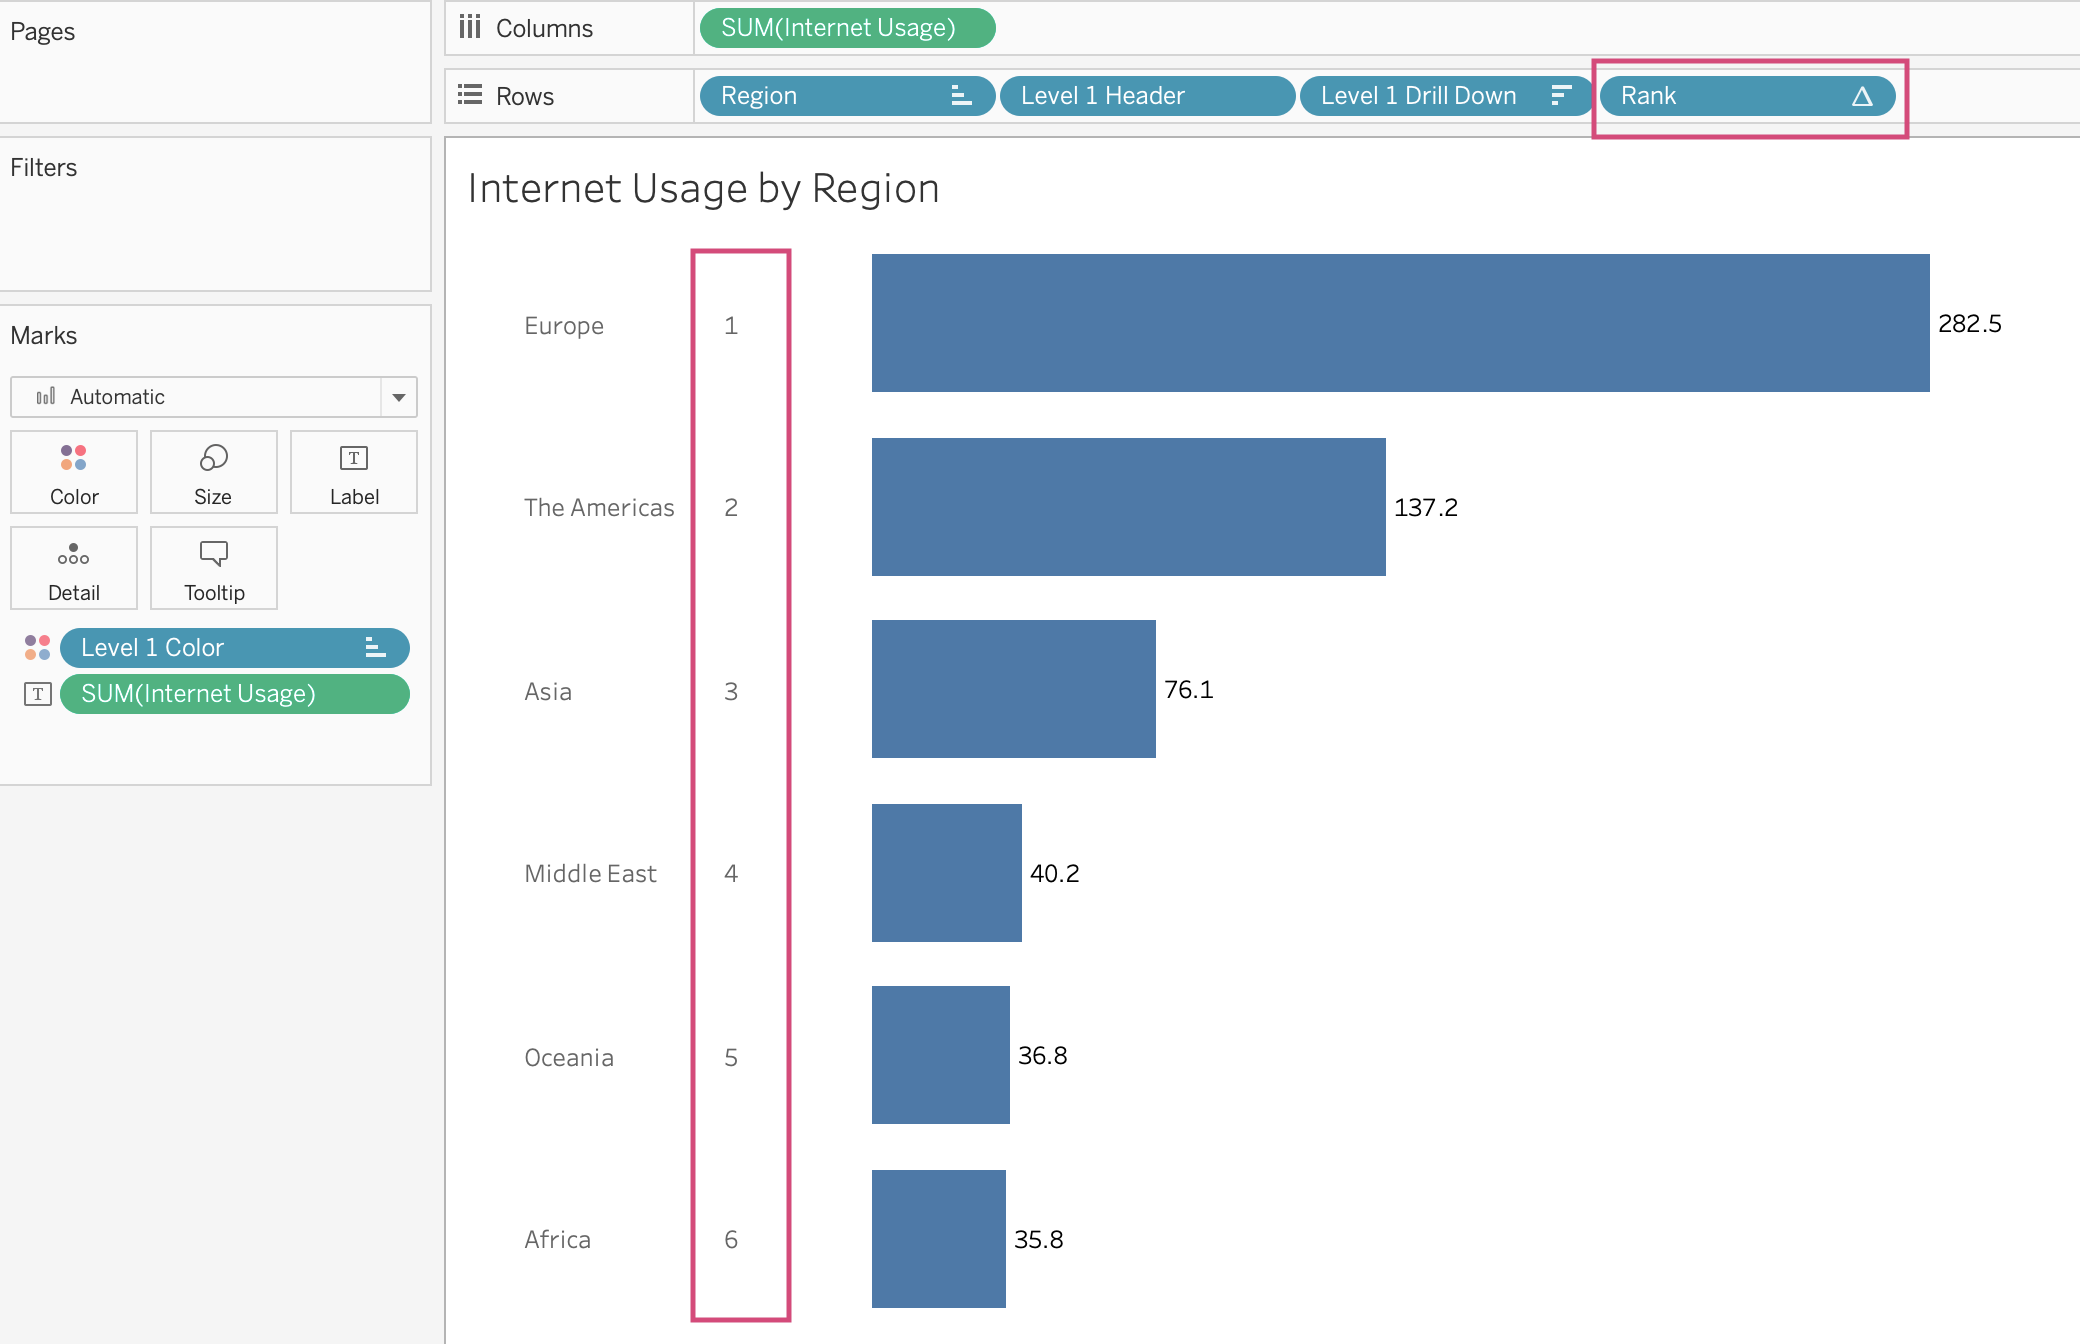
Step 3: Drag the Rank Calculated Field to Rows to get the rank for each row. As we did the Rank Calculated Field in Step 2, the order is descending. Europe has the most Internet Usage, so the rank is 1. However, this rank is in the Region level. I only want the rank in Level 1 Drill Down for each country in the region.
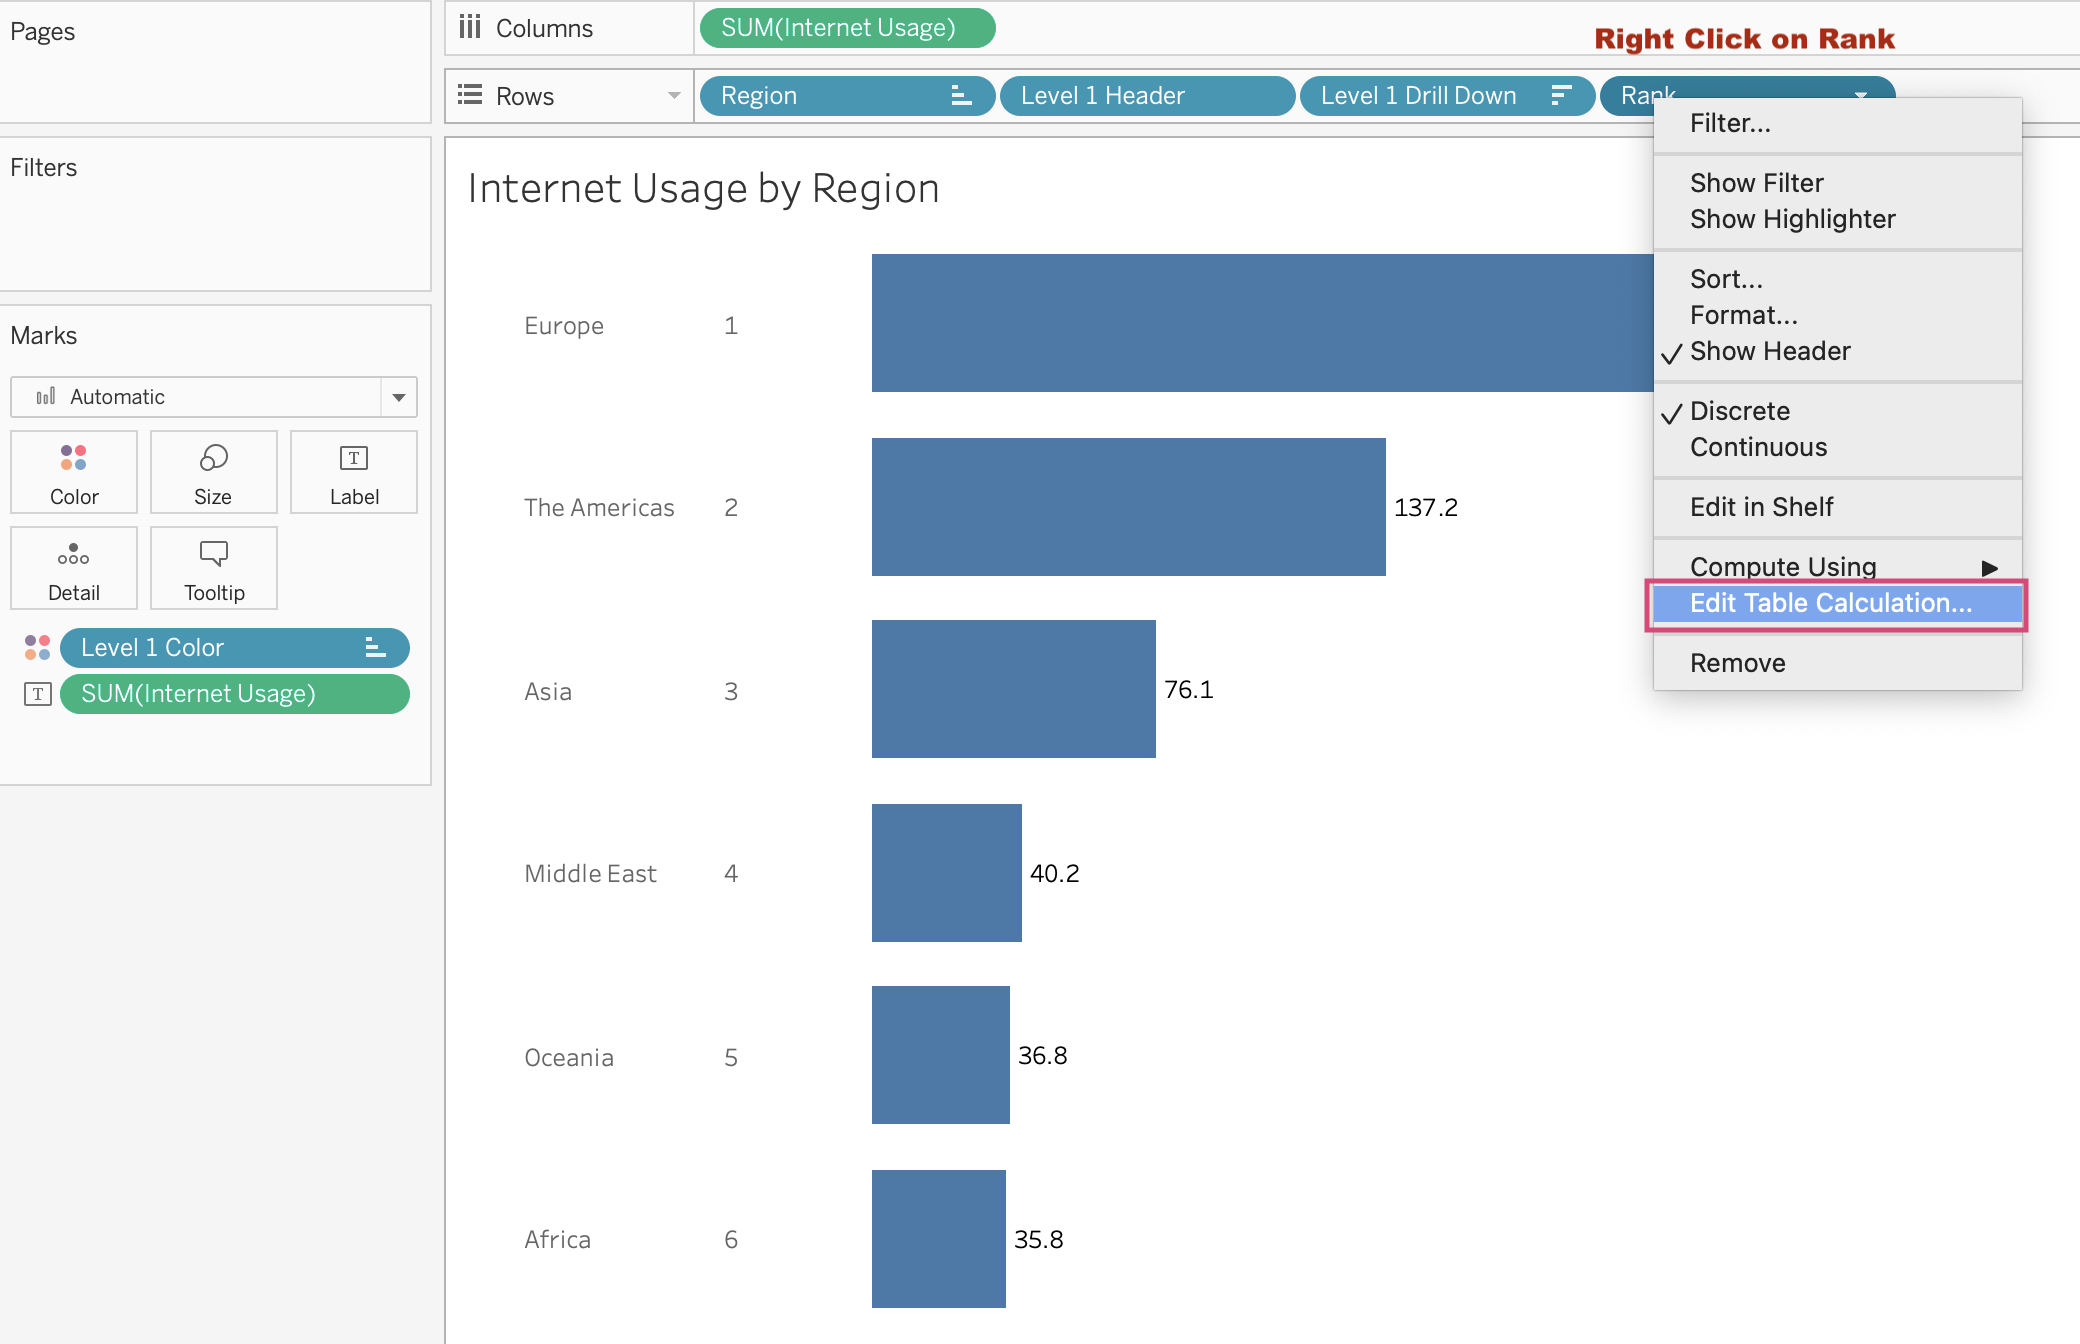
Therefore, I need to Edit Table Calculations. Right click on the Rank and choose Edit Table Calculation...
When the Table Calculation window shows up, I choose Specific Dimensions and only check Level 1 Drill Down level. Immediately, the rank in Region level becomes 1.
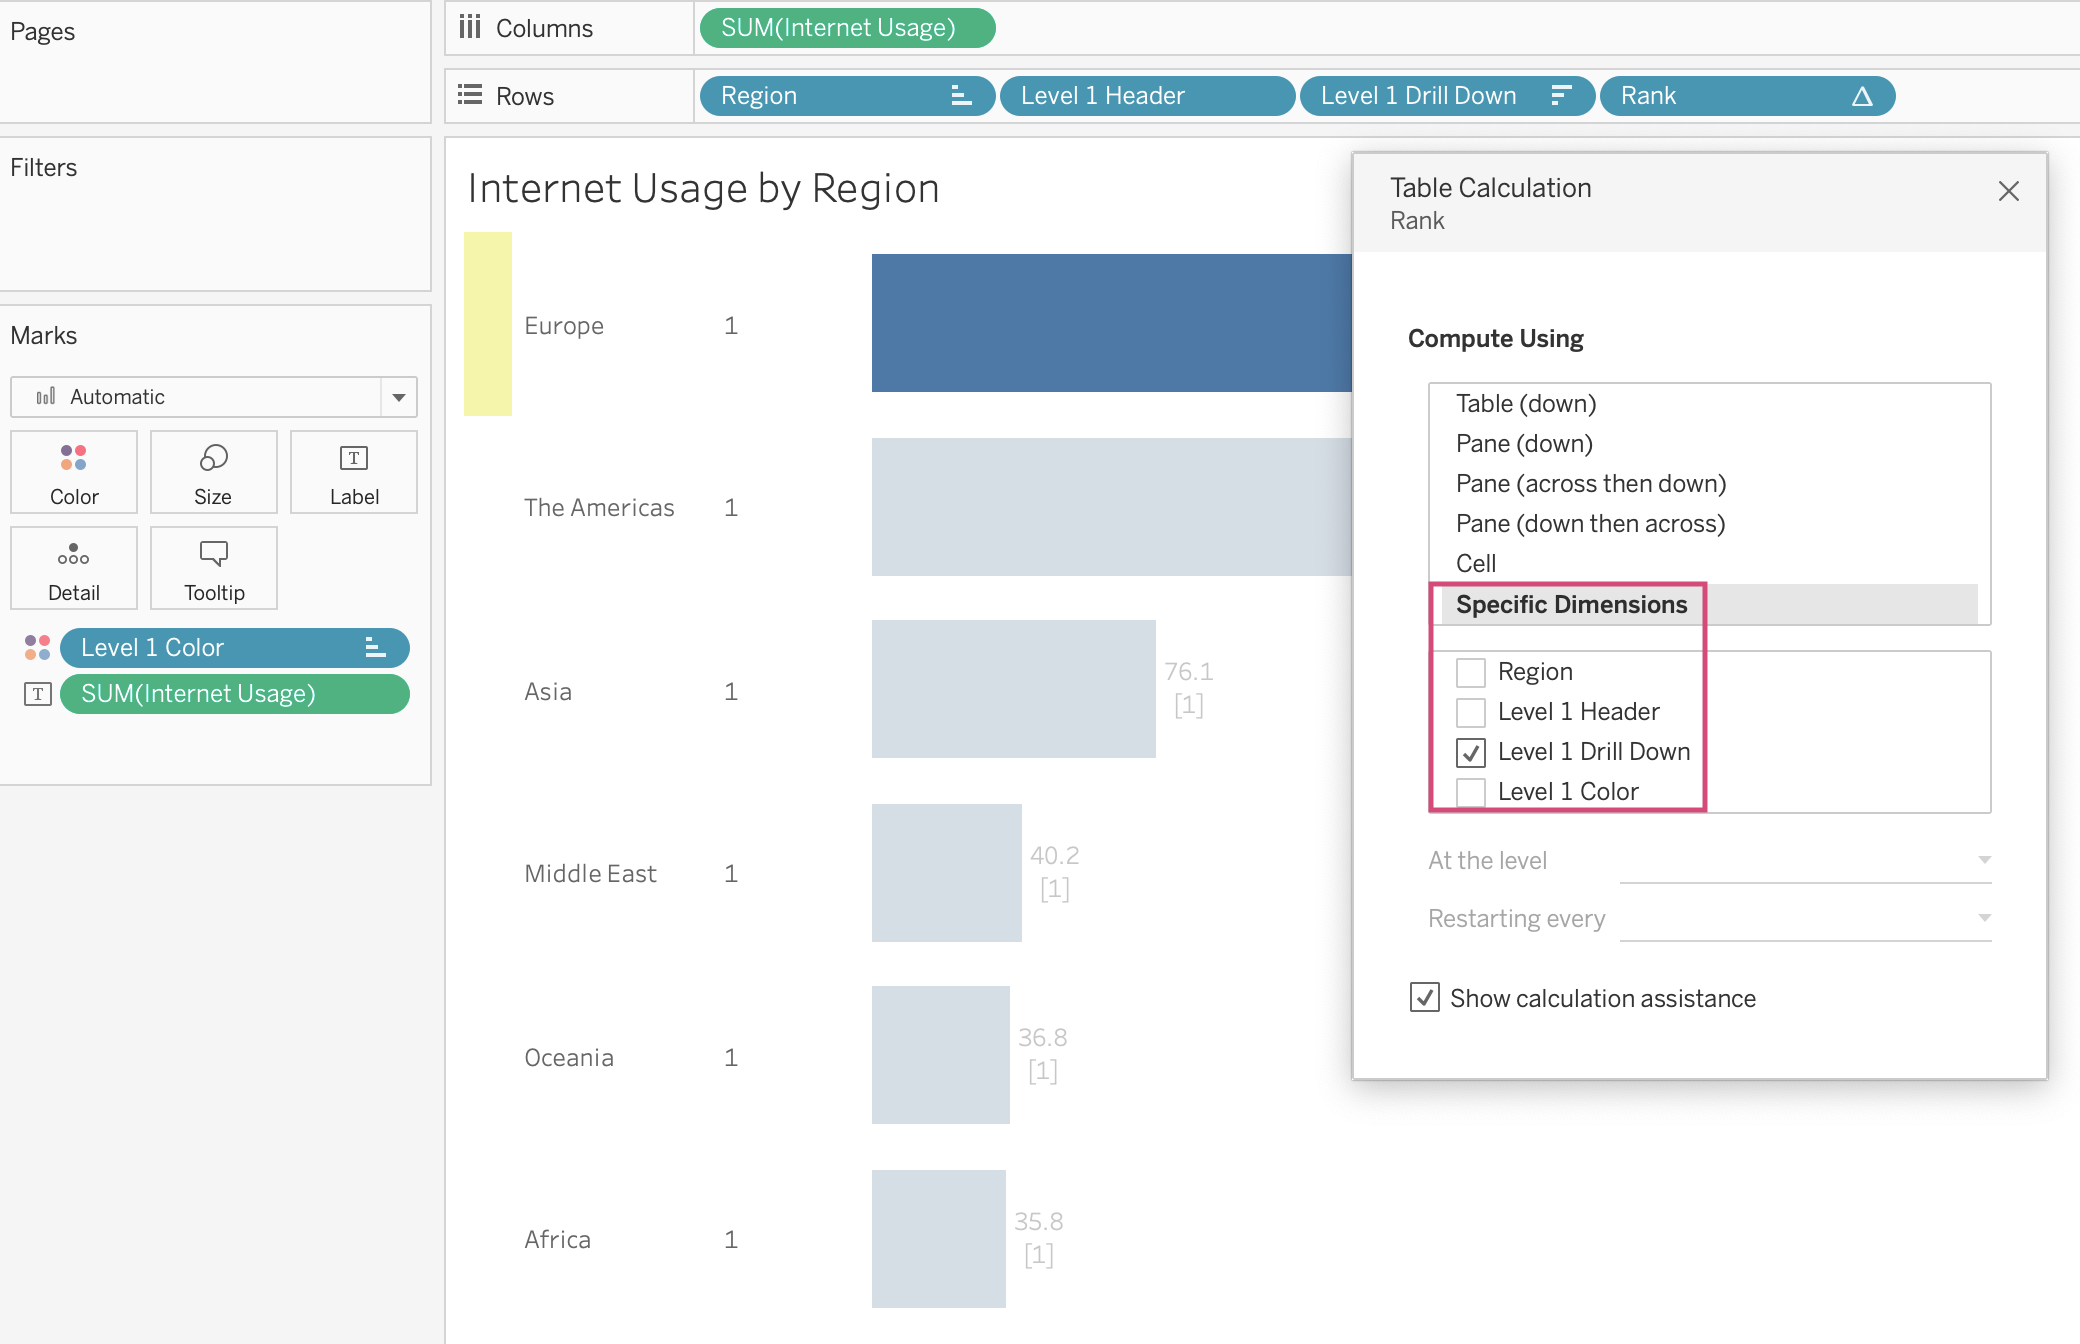
But the rank in Level 1 Drill Down is still there. There are some Null values without ranking.
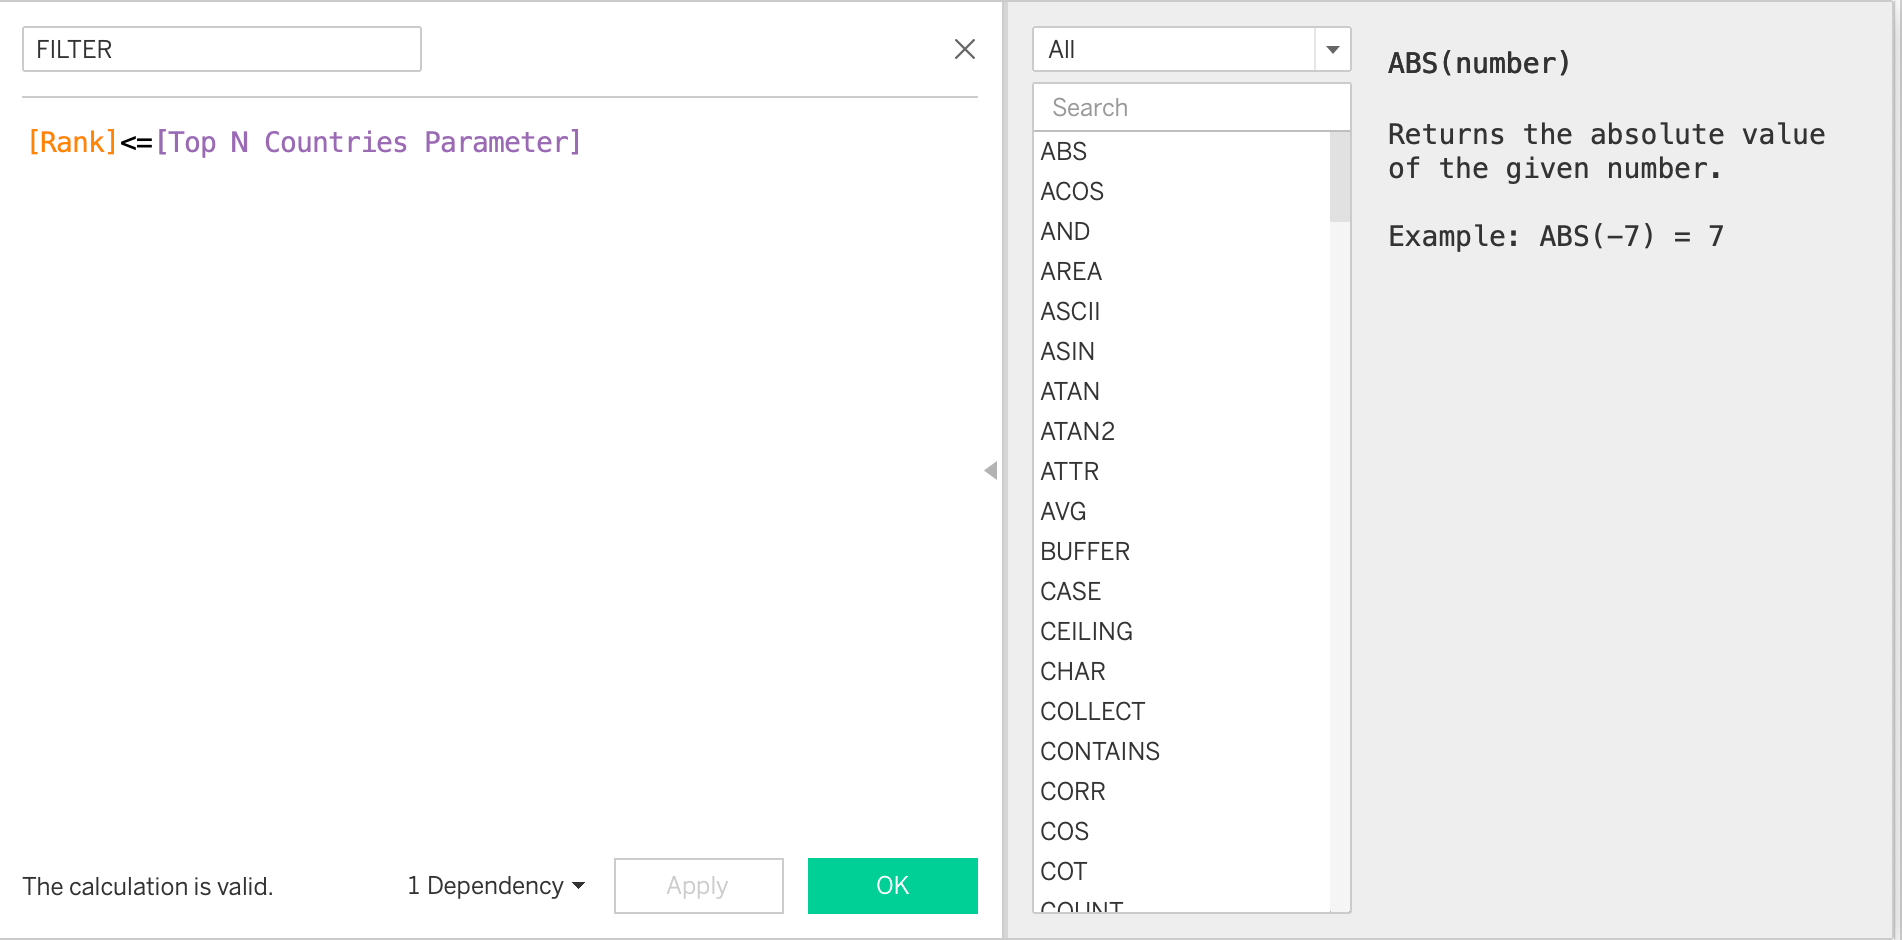
Step 4: In this step, I will filter my data to get only top rows that I want. I created another Calculated Field and called it FILTER. It's a Boolean type to check if the rank is less or equal than Top N Countries Parameter True.
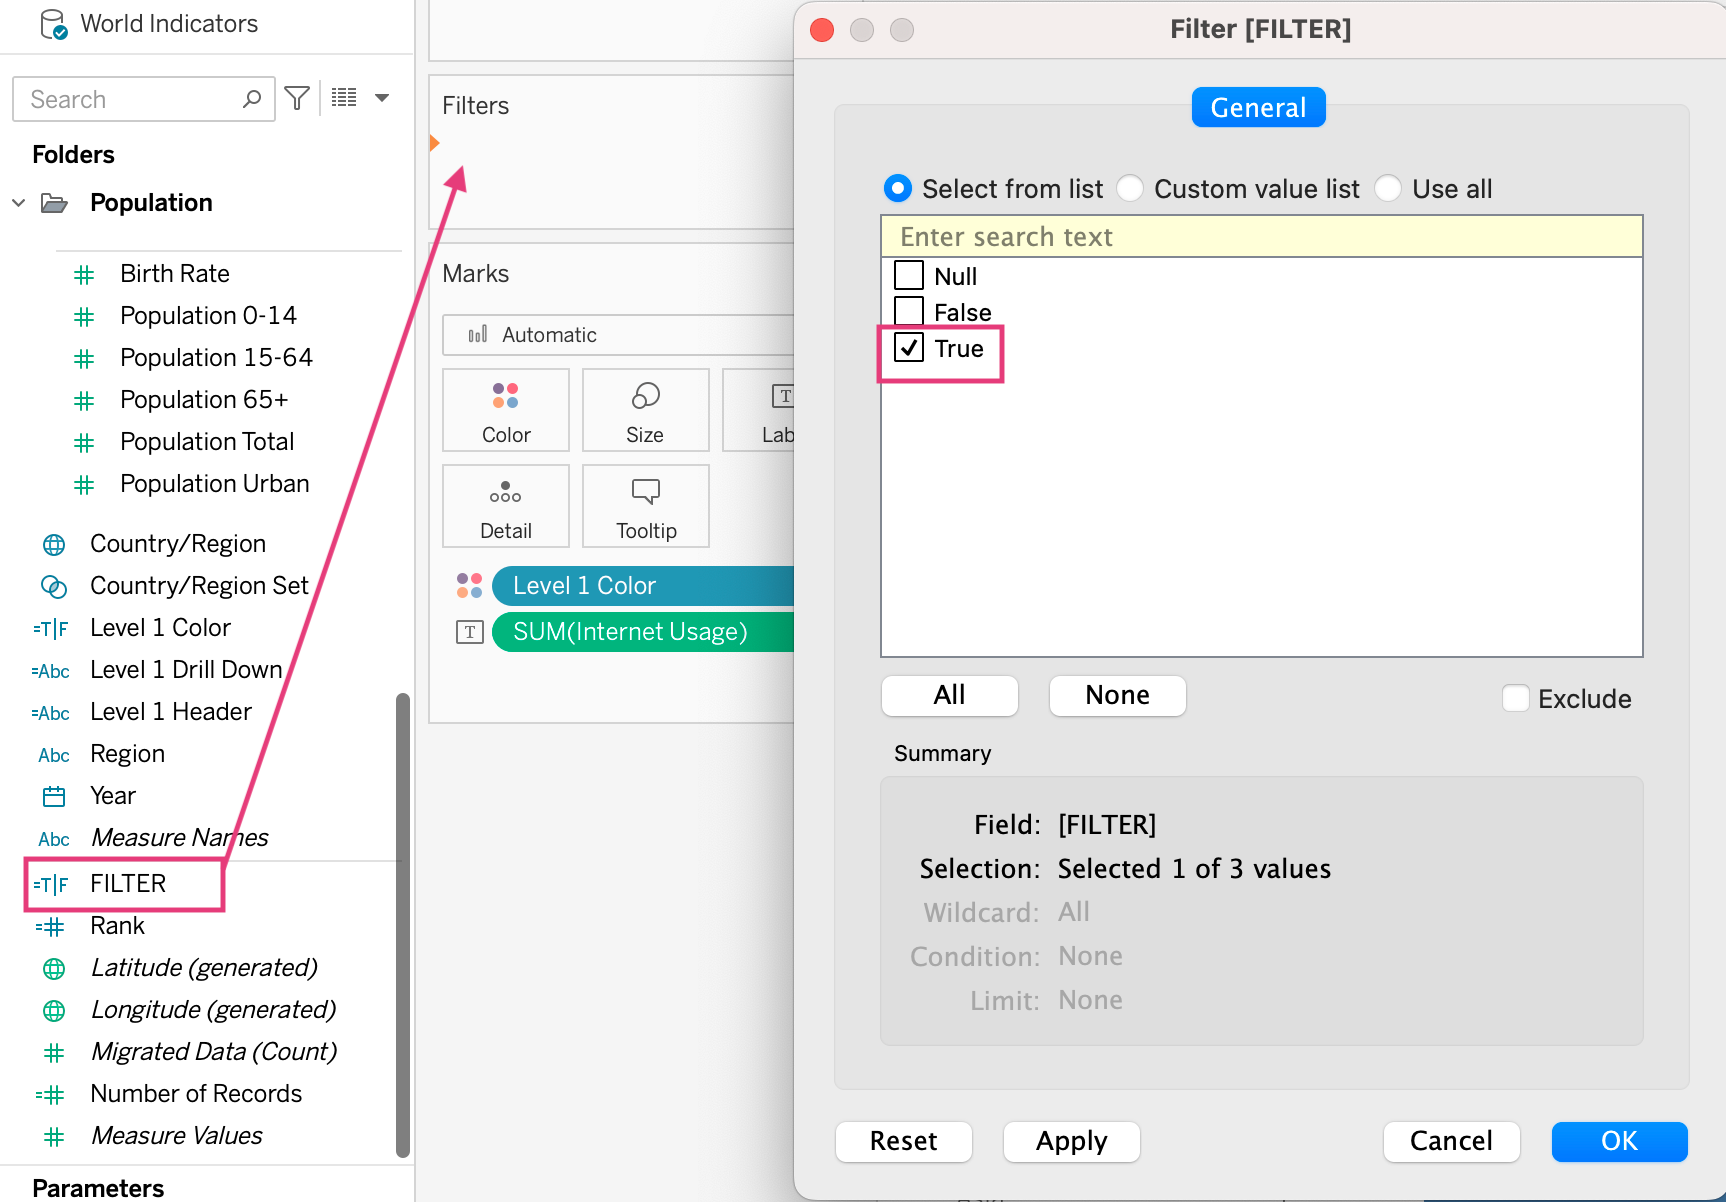
Then, drag FILTER to the Filter box and choose TRUE only.
Step 5: I will show Top N Countries Parameter and Hide the header of the Rank. I got the result satisfied all 3 points in the beginning.
Thanks to this assignment, I learned a new way to control number of rows that I would like to show by using Rank() function and the table calculation. I hope you enjoy this blog and get some ideas to build visualization.
See you in the next blog!