


According to the Tableau page, Table Calculation is a transformation that the user could apply to the visualization in Tableau. Table Calculation is a special type of calculated field that computes the local data.
In the second week of training, I learned about what is Table Calculation and how to use it in Tableau. Michael McFadden currently is my coach introduced how Table Calculation computes and transforms the data. In this blog, I will summarize all dimensions that Table Calculation could transform the data.
I am going to use the example from Michael to explore the way Table Calculation computes data. I use the Superstore data source in Tableau. I drag Order Date to Columns as a dimension and choose Weekday. I also drag Order Date to Columns as a dimension and choose Month. I create a new calculation for INDEX() function and drag it to Text to show values on the table. (Image 1)
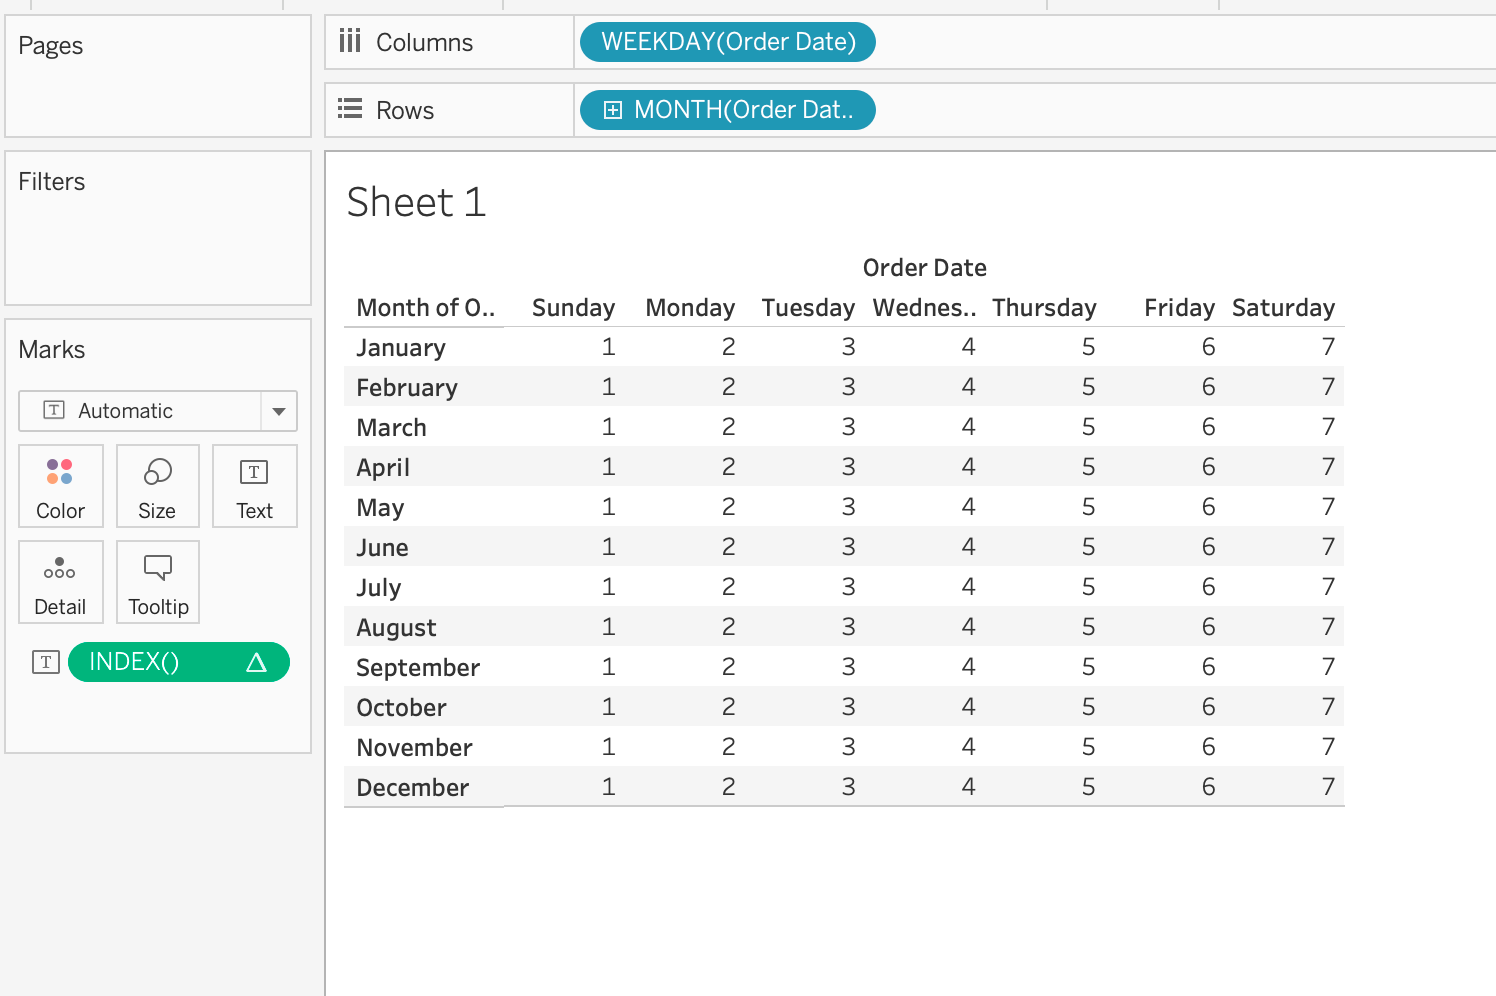
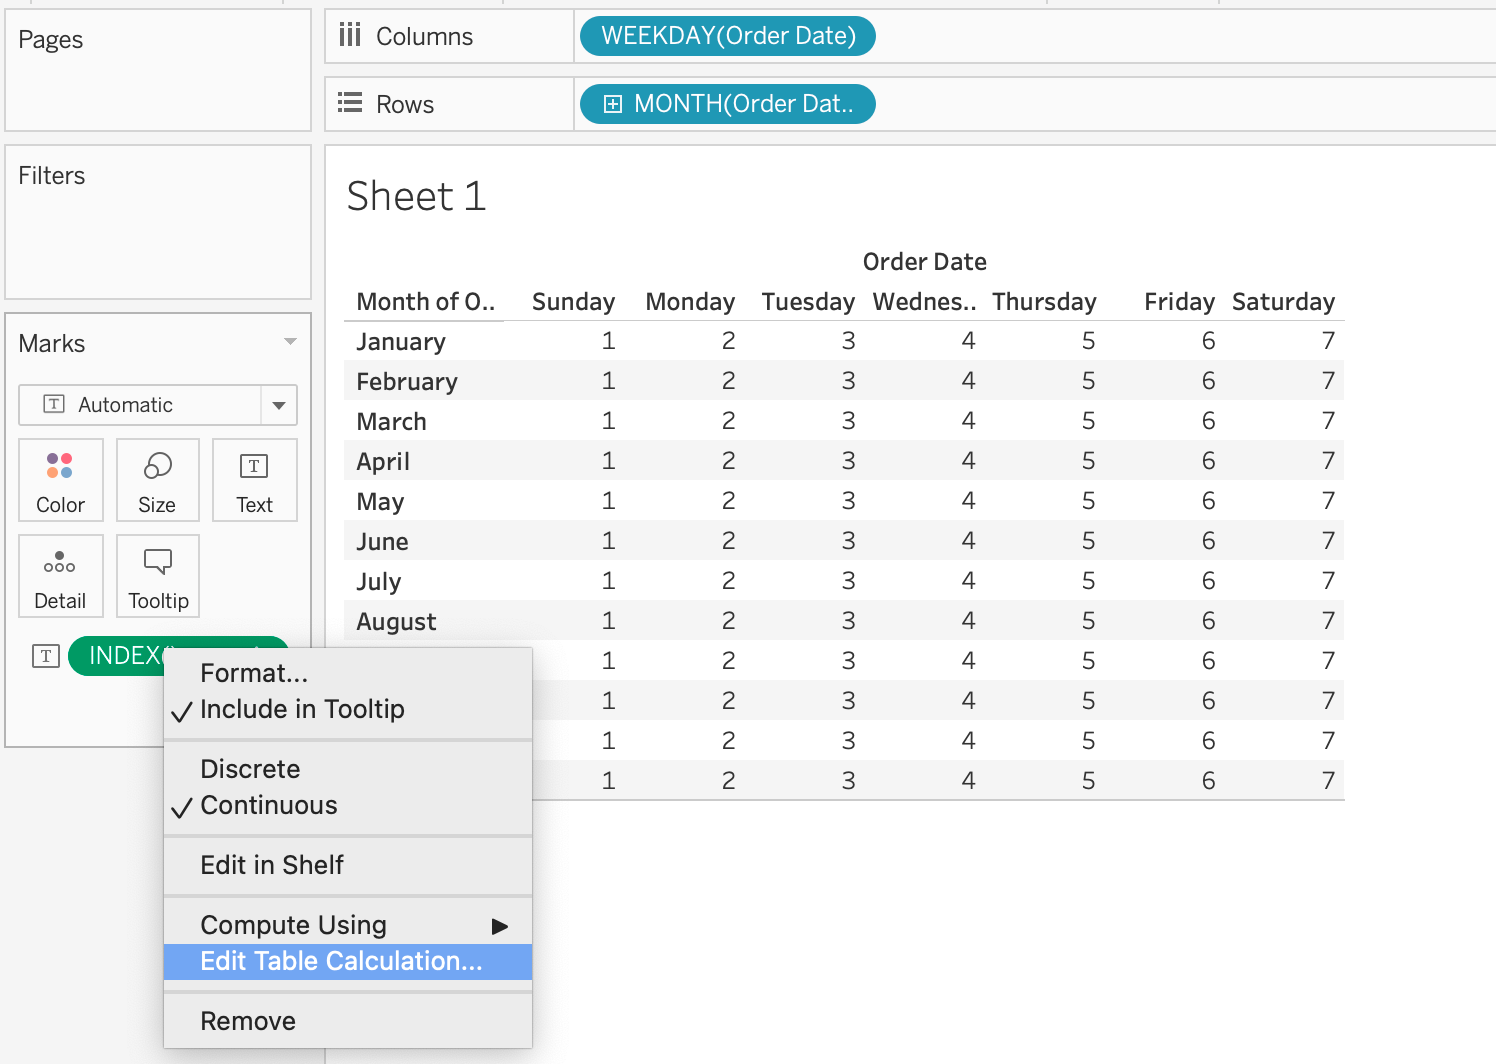
Then, right click on the INDEX() calculation to choose Edit Table Calculation. After choosing that option, the Table Calculation window opens.
Now, let's explore Table Calculation in Tableau.
Table Across
In the Table Calculation window, I chose Table (across). Tableau will understand that I would like to compute the data in each row from left to right.
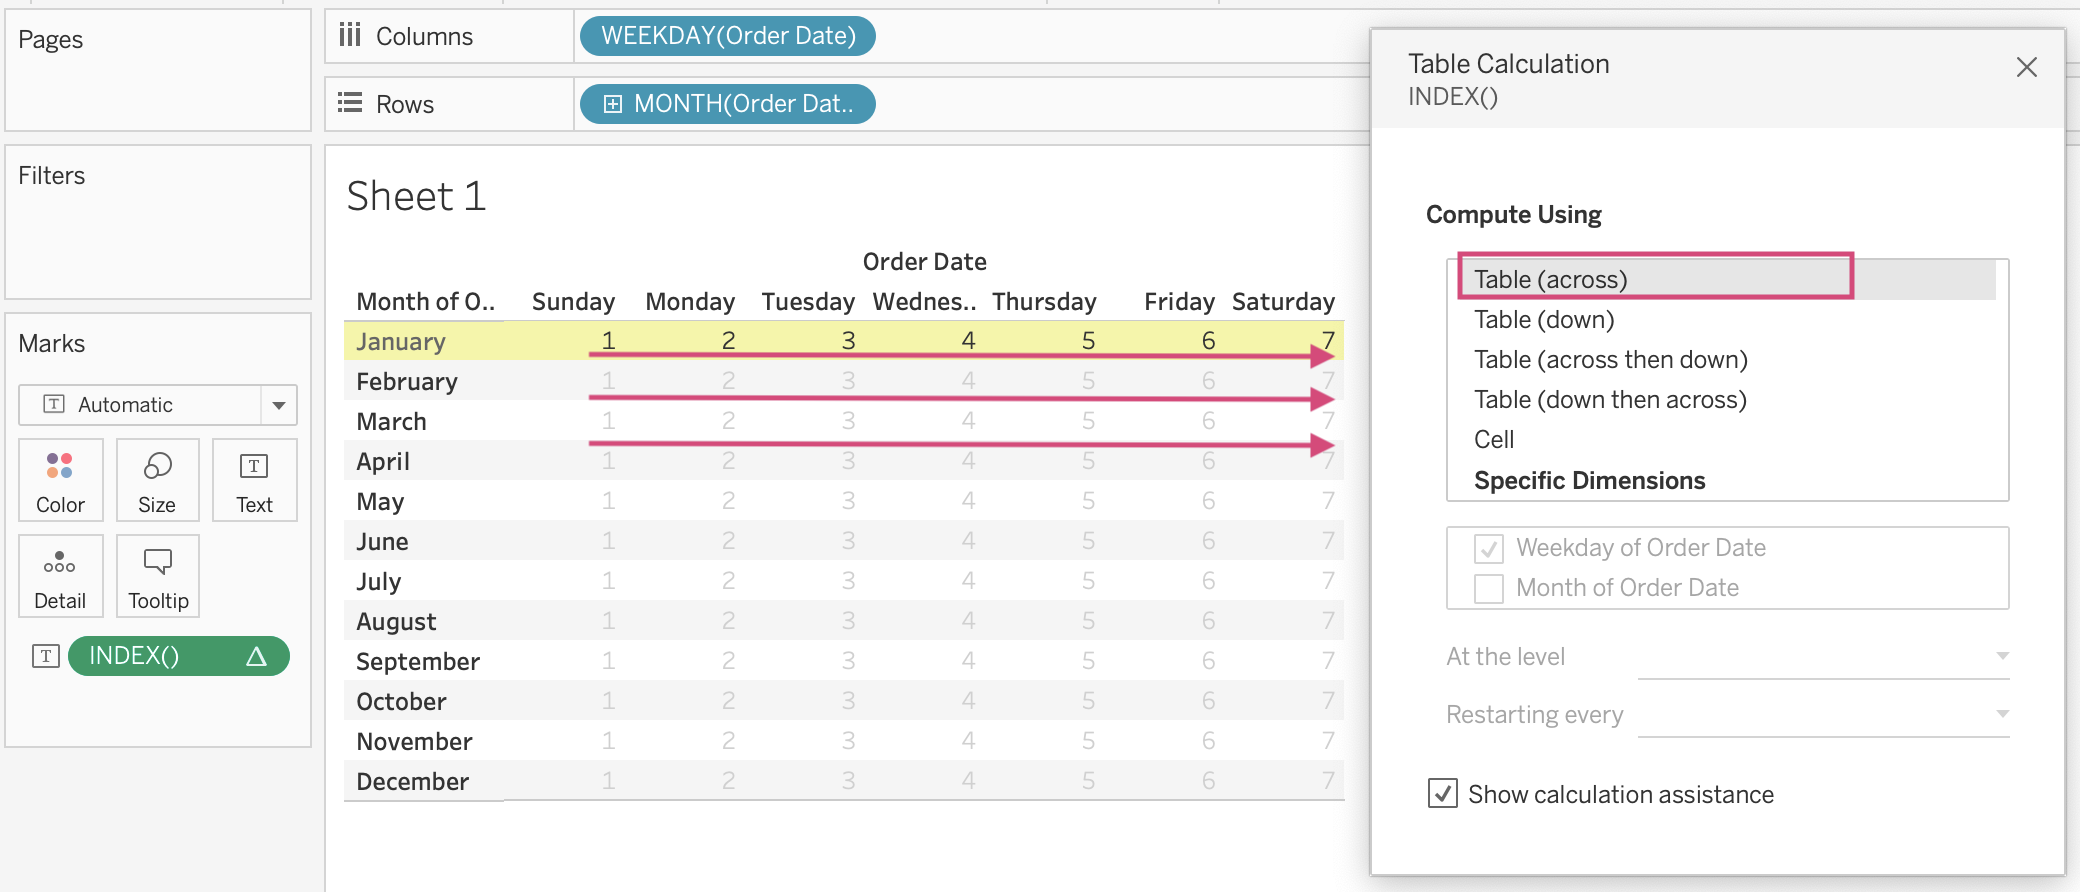
Table Down
If I choose Table (down), Tableau will understand that I would like to compute data in each column from the top to bottom.
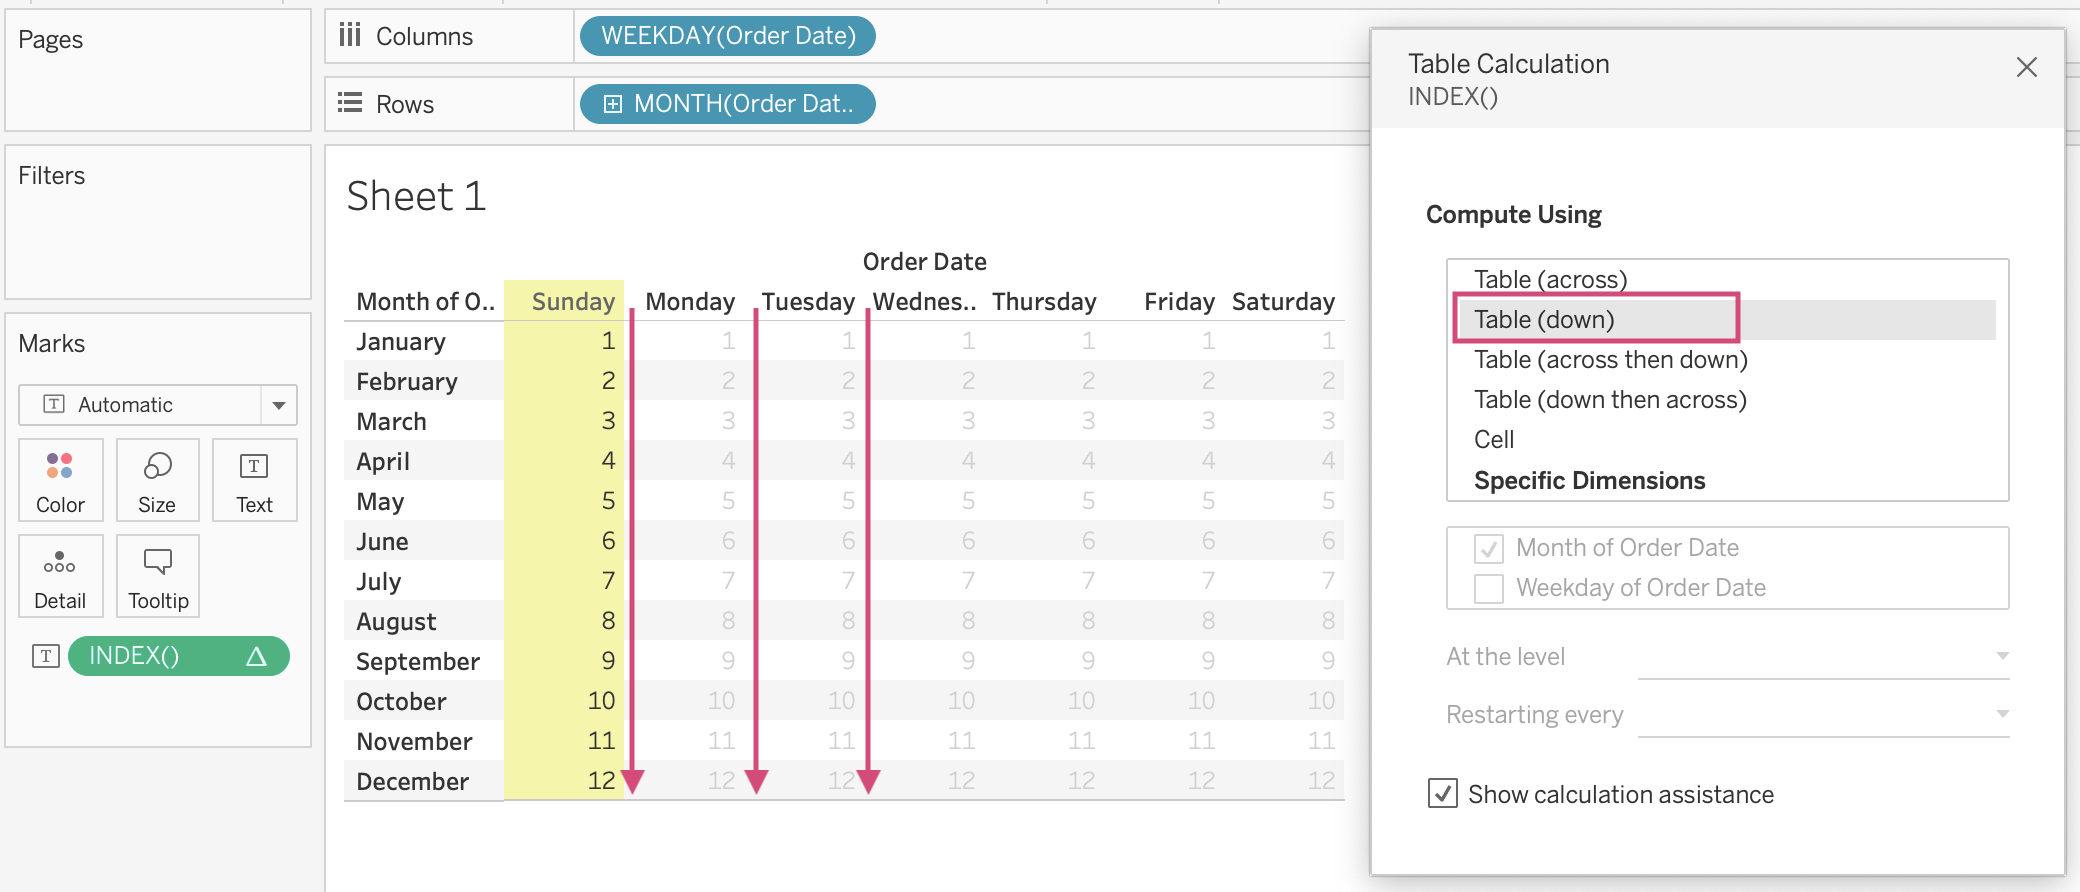
Table (Across then Down)
In this option, Tableau will do calculate data from the top left to top right on the top row first and then moving down to the most left of the next row (Zigzag sign). It continues to compute until the end of the table which is the bottom right corner. In the image below, the point is 84. (Image 5)
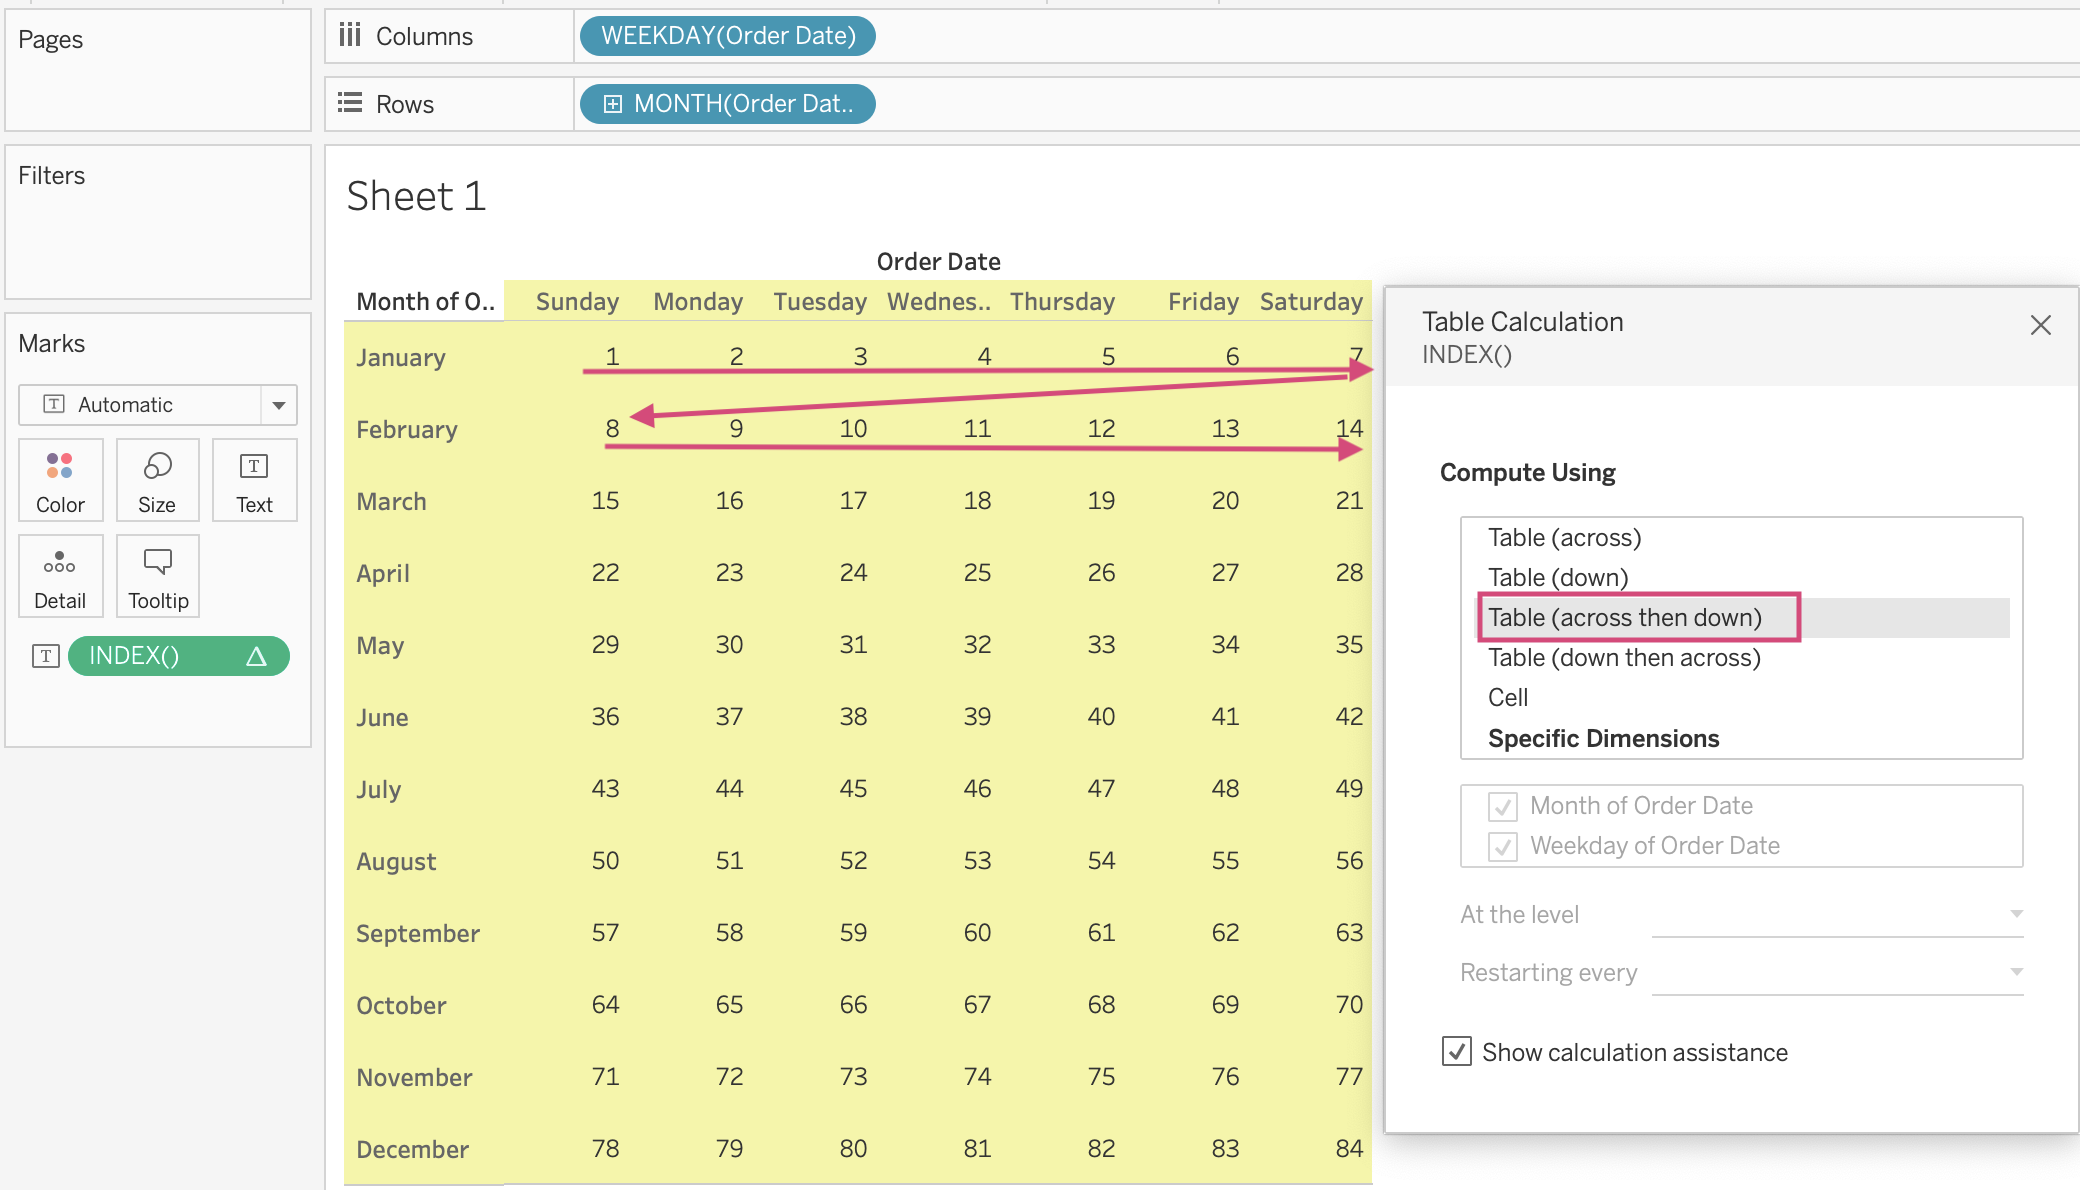
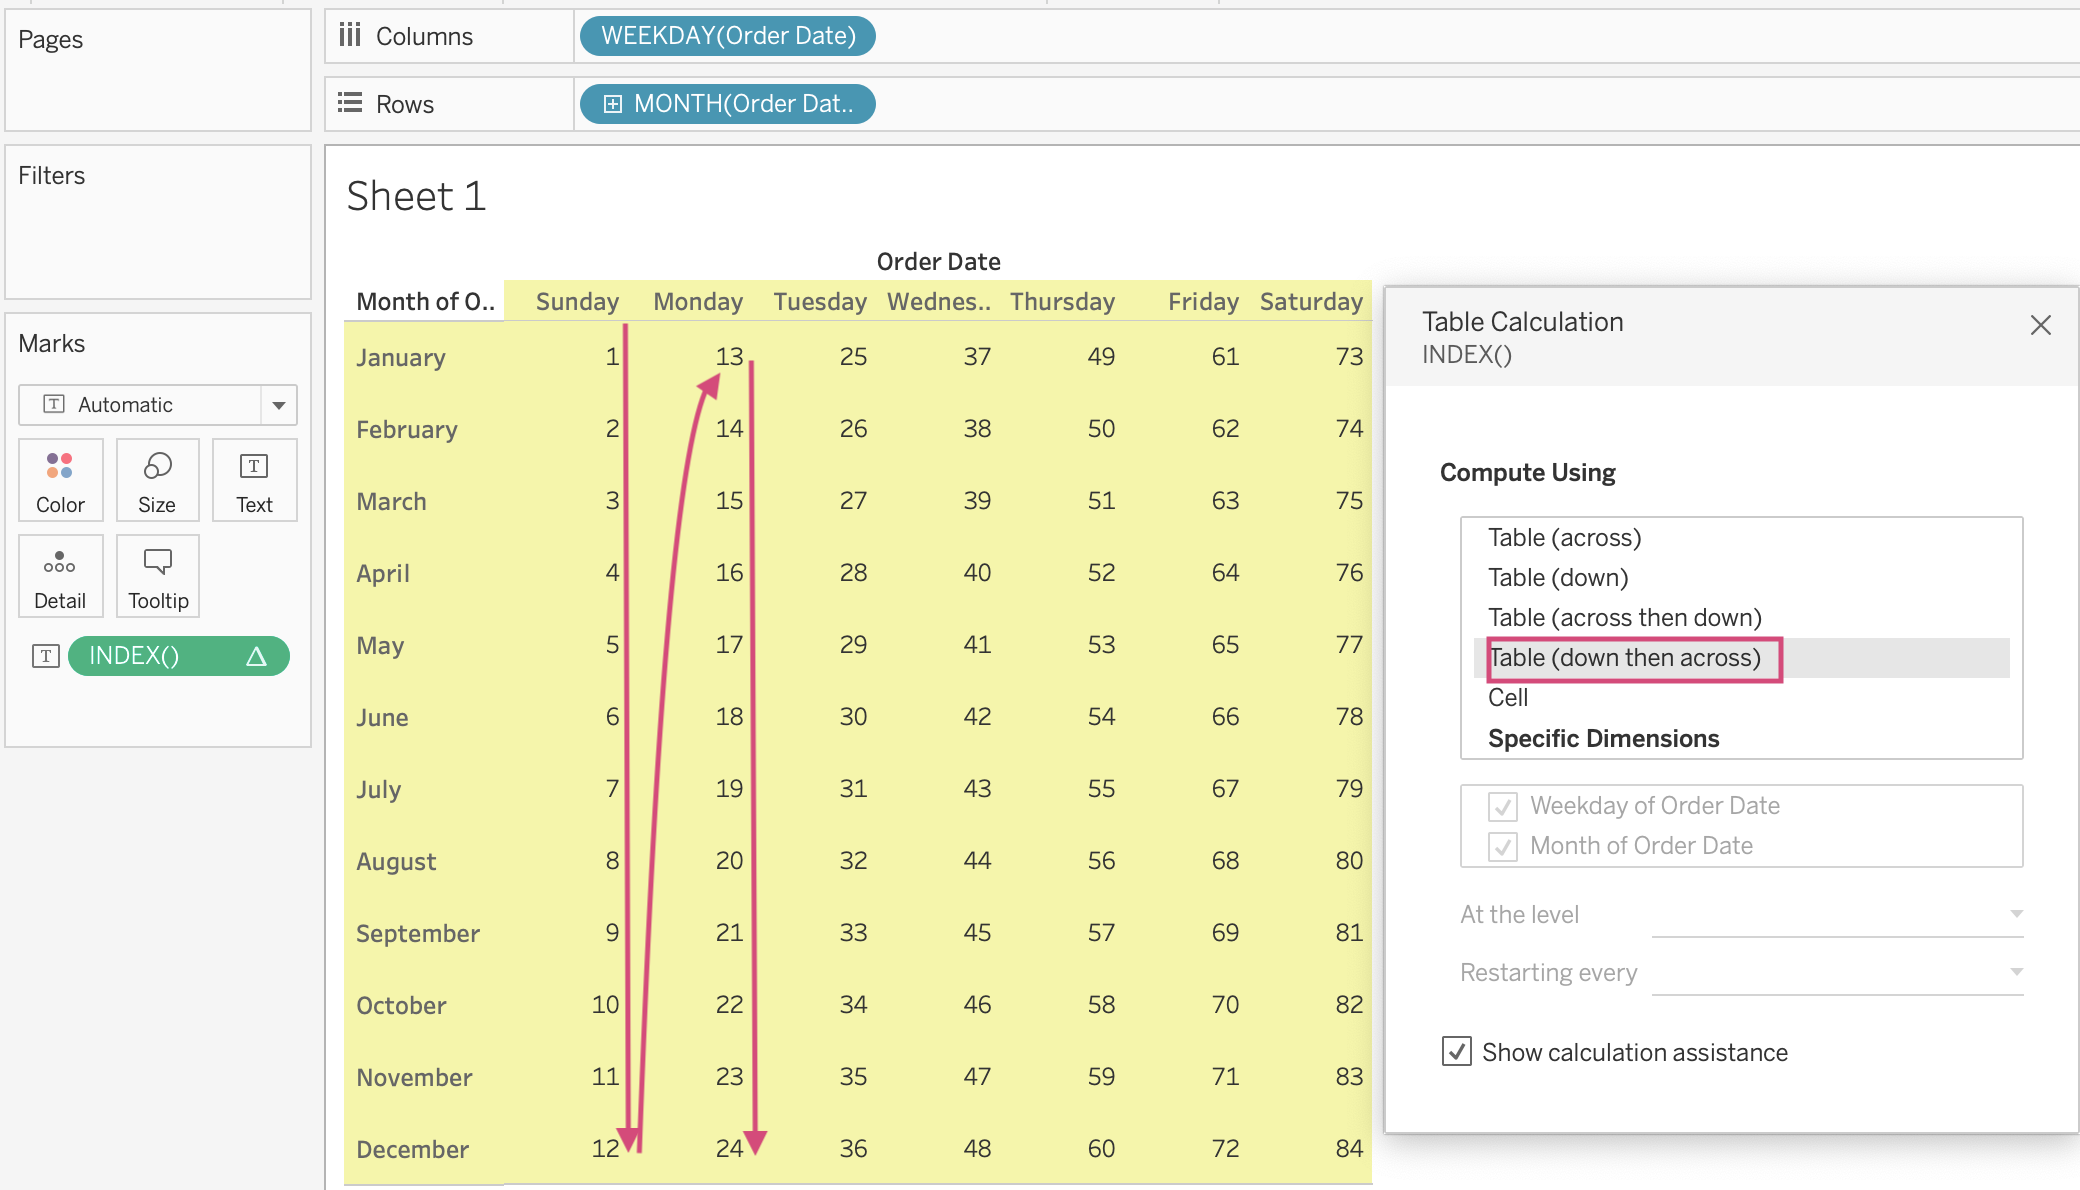
Table (Down then Across)
Opposite to the Table (Across then Down) above, the Table (Down then Across) will compute data from the top left of the table to the bottom in the most left column. Then, it continues to compute data on the second column next to the first column from the top to bottom. (Image 6)
If there are more dimensions (level of details) in Rows or Columns, besides the Table dimensions, the user have more options to compute the data: Pane across, Pane down, Pane (across then down), Pane (down then across).
...
I will continue in the next blog with more details in Specific Dimensions option.
See you in Table Calculation in Tableau - Part 2 blog!