In the first part of Macro in Alteryx, I introduced the overview of macro, the type of macro, and a demo for standard macro and batch macro. Continue to the first part, I am going to write about the Iterative Macro in Alteryx. In this blog, I will go through:
1/ What is Iterative Macro in Alteryx?
2/ What is the difference between Iterative Macro and other types of macro?
3/ Building an Iterative Macro from a flow chart
Are you ready to explore the Iterative Macro? Let's get started!
1/ What is Iterative Macro in Alteryx?
Iterative Macro is the same as a loop. It will continue to run until the specified condition is met. If you have worked with other programming languages (SQL, Python, C++), this Iterative Macro is the While loop. As a loop, the iteration will run as many times as specified or until the condition is met.
2/ Difference between Iterative Macro and Other Types of Macro?
Standard Macro: if a process ( a group of tools) is repeated multiple times across different workflows, then the user can consider choosing the standard macro.
Batch Macro: if the user needs to repeat the process multiple times by inputting different values, then the workflow will process independently. The final output will be the union of all individual outputs. The data can be processed all at once or grouped in the batch.
Iterative Macro: the process runs over and over again until the specified condition is met. The user can control when the process is stopped by giving a loop time or a condition.
3/ Building an Iterative Macro from a Flow Chart
Iterative Macro is usually used in calculating the interest, saving amount, or web scraping when the user wants to parse data from page 1 to page N. In Math, the Iterative Macro can be used in factorial or getting the Fibonacci sequence.
To describe how the Iterative Macro works in Alteryx, I use the flow chart. The oval shape represents Input/ Output values. The square shape represents the expression. The diamond shape represents the condition (Image 2).
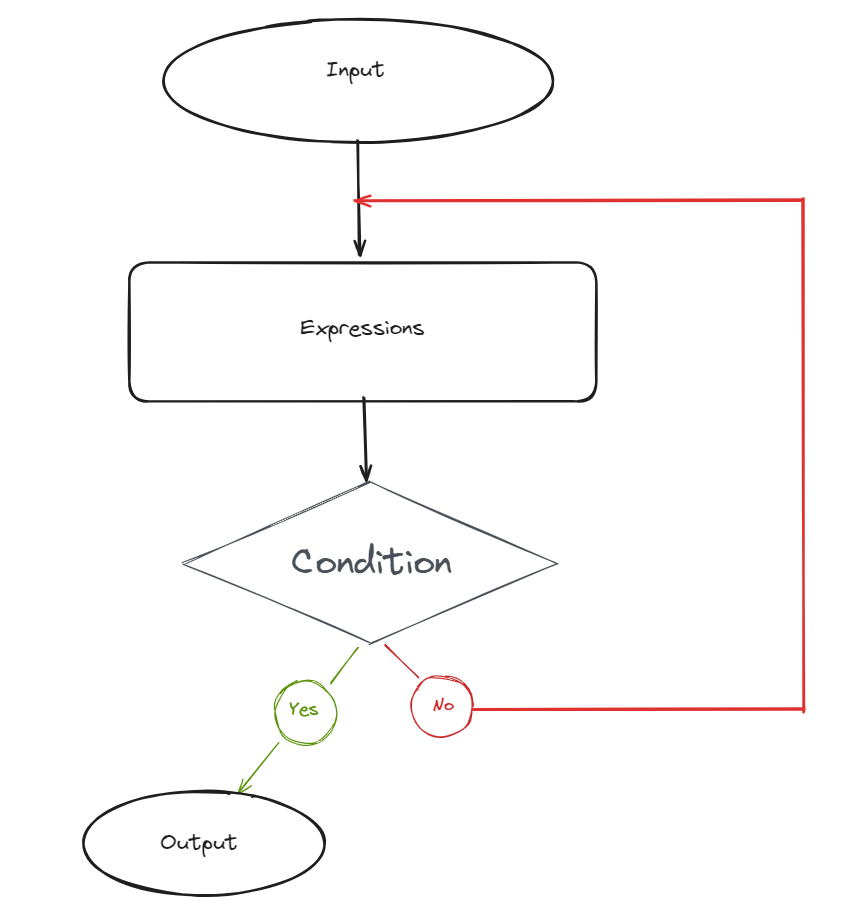
From the flow chart (Image 2), the flow will start from the input first. After getting the data from the input, the data will be aggregated in the expression part. Then, the flow will check if the condition is met. If the condition is not satisfied, it will go back to the step before expression to do again (No branch). Until the condition is met, then the flow will go to the Output step and stop.
To explain in more detail how the flow chart is helpful. I got an example that I learned during training at The Data School to show.
Problem: Given the investment amount, the user inputs the Interest Rate and number of years to see how much money can be earned until that year. Known that the interest amount will be cumulative to the investment amount.
Analysis of the problem: before sketching the flow chart, I need to decide what is the input, output, expression, and condition.
- Input: Investment Amount, Interest Rate, number of years
- Output: Total amount after the specified years
- Expression: Whenever the year increases by one, the new Investment Amount equals the current Investment Amount plus the Interest Amount after a year. Therefore, Investment Amount = Investment Amount + (Investment Amount * Interest Rate).
- Condition: we would like to see how much money can be earned until a specified year. So the condition is if the year is still less than the specified year, then continue to loop back to the step before the expression to increase year by one. If the year iterates greater or equal to the specified year, then stop the workflow.
Flow Chart:
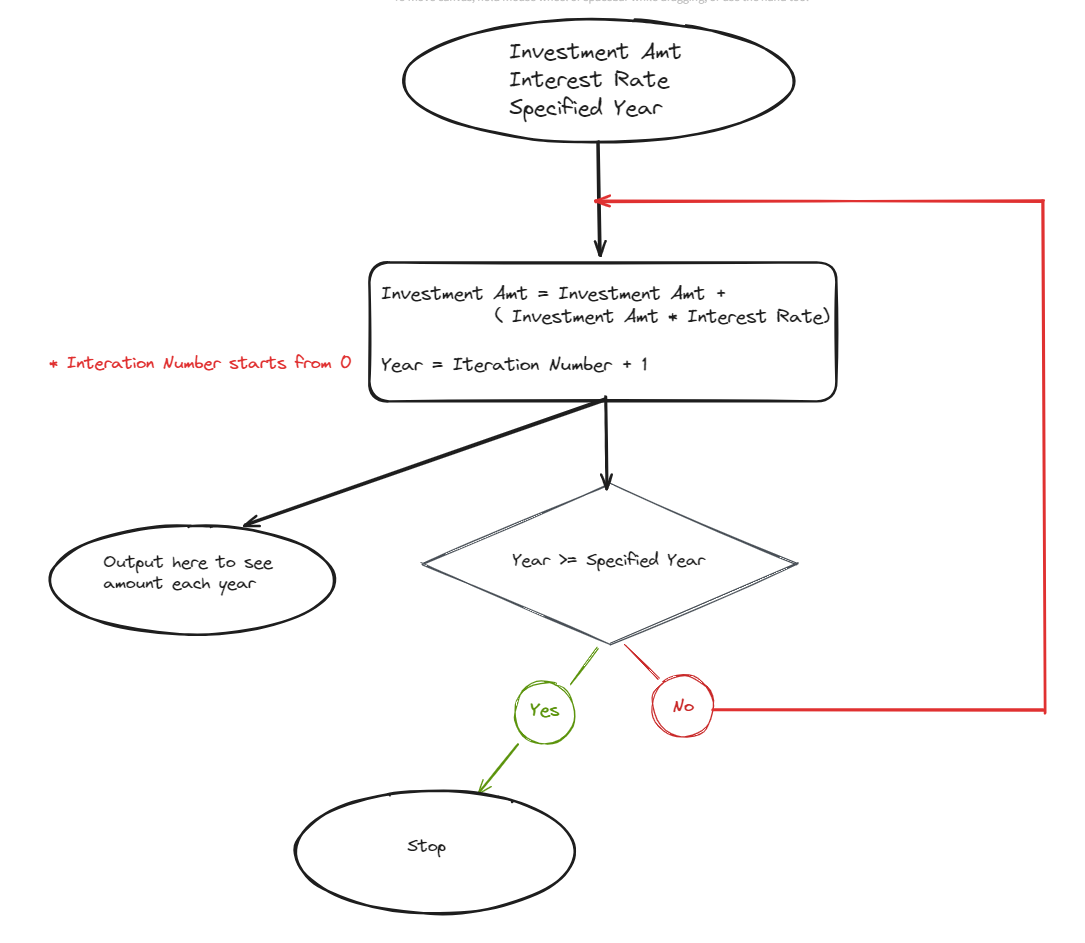
From the flow chart (Image 3) above:
First Oval from the top: the user will specify the Investment amount, Interest Rate and Specified Year.
Square Shape: Then do calculate the Investment amount after each year by the expression in the square shape above. Also, in this step, increase the year by one. In Iterative Macro, there is a variable called Iteration Engine Number; after each loop, this Iteration Engine Number will increase following what we will specify. In this case, I only want the year increase by one after each loop. So the year equals Iteration Number +1. (Note that Iteration Number start from 0)
Diamond Shape: It will check the year is greater or equal to the Specified Year at the beginning. If it's false, then loop back to the step before the Square Shape (expression).
Last Oval at the bottom: there are 2 ovals (2 options). If you want to output the final result for the final amount after a specified year, you can output when the condition is met. If you want to show the amount each year, you can output after the expression.
In Alteryx:
I will set up tools same as the flow chart above.
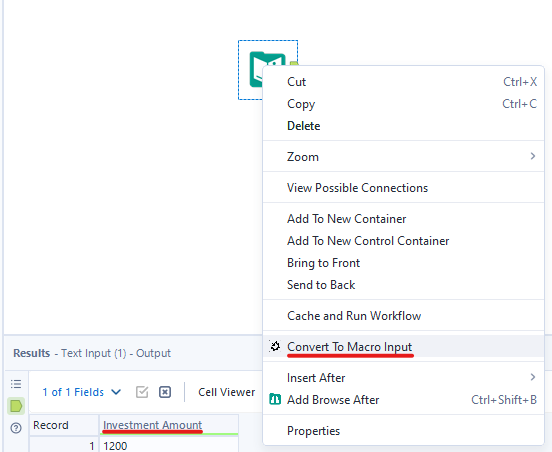
First of all, I need an Investment Amount input. I used the Text Input tool to create an Investment Amount column and set the initial value. Then right-click on the Text Input tool and choose Convert to Macro Input (Image 4).
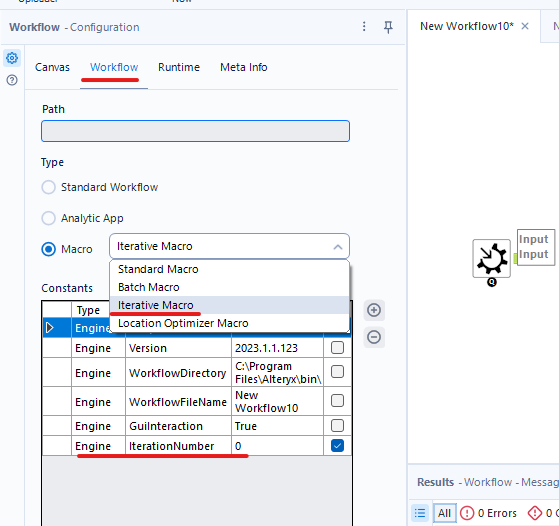
Then click on the blank space on canvas. In the Configuration window, choose Workflow menu and select Macro radio button. In the Drill Down menu, I choose Iterative Macro. After you choose Iterative Macro, in the Constants window, it will appear IterationNumber starts from 0 (Image 5).
In the next step, I will follow the square shape for expression in the flow chart. I need 2 specified values: one for Interest Rate and one for Year. The user can adjust the Interest Rate value by using Interface tools. I will need to update the Investment Amount by the expression (Image 6).
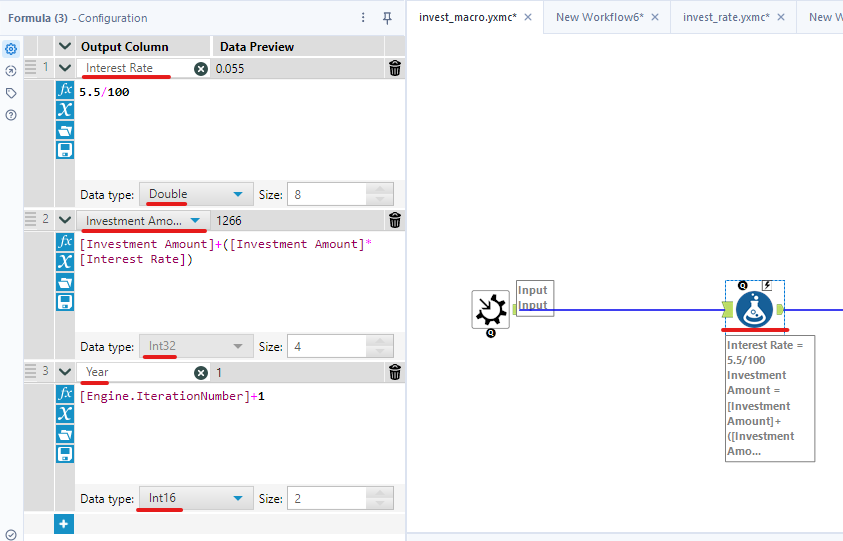
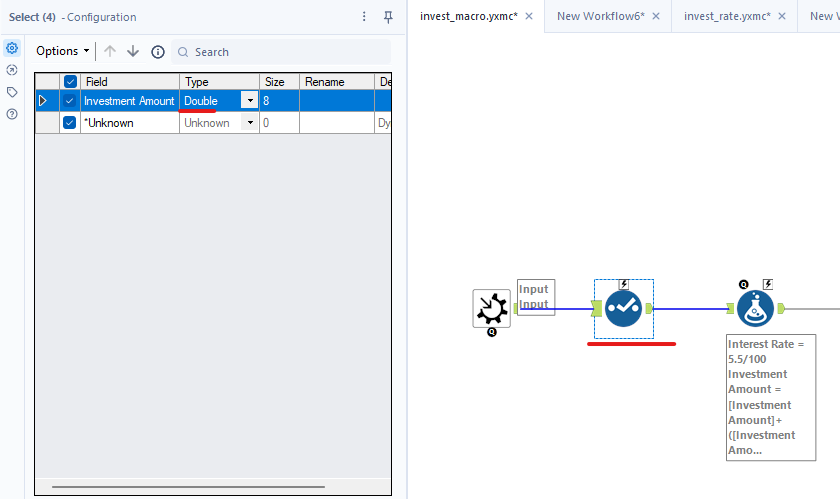
As you noted, I set the data type for Interest Rate is Double. However, when I update the Investment Amount field, I cannot change the original data type. The Investment Amount will have some decimal numbers after multiply by the Interest Rate. Therefore, I need to change the data type for the Investment Amount. To do that, I will use the Select tool before the Formula tool to change data type from Int32 to Double (Image 7).
Next, after the expression is the condition to check if the current year is greater than the specified year or not. I use the Filter tool. If the current year is greater than the specified year, I need to stop the workflow (Yes or True branch in the flow chart). If the current year is still less than the specified year (No or False branch in the flow chart), then I keep going to loop (Image 8). I specified the year is 5 by default. But we can change it later.
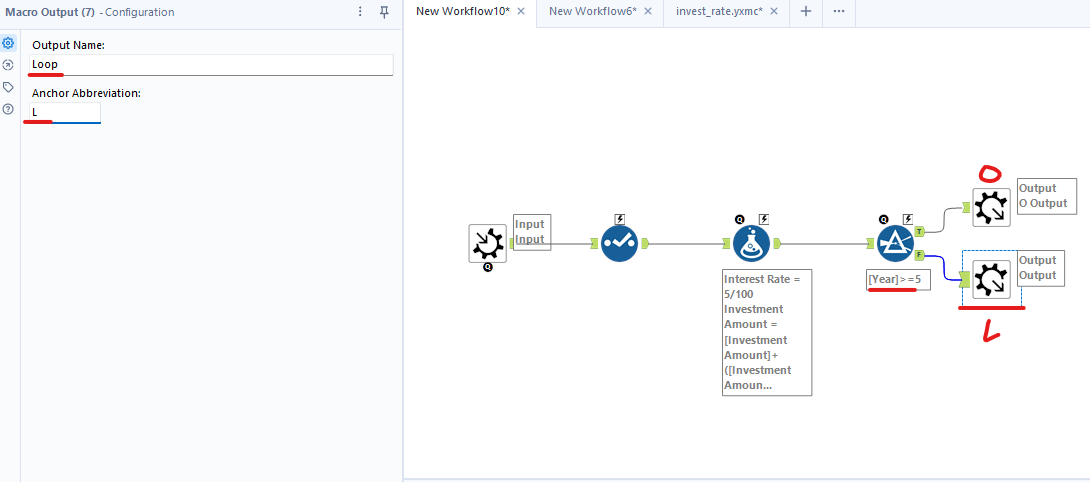
I connect the Browse Tools to both True and False output anchors in the Filter tool. Then, I changed those 2 Browse tools to Macro Output. I also set the name for T is the Output with Anchor Abbreviation is O. The False Output will loop again, so I named it Loop and Anchor Abbr is L (Image 8).
The Interest Rate and Specified year are fixed number. But I want the user to adjust it. So I use the Interface tool to connect with the Formula tool to adjust the Interest Rate value (Image 9). Then, I set value for Minimum, Maximum, Increment (each time we adjust how much it will increase/ decrease), Default value, and Decimal Places.
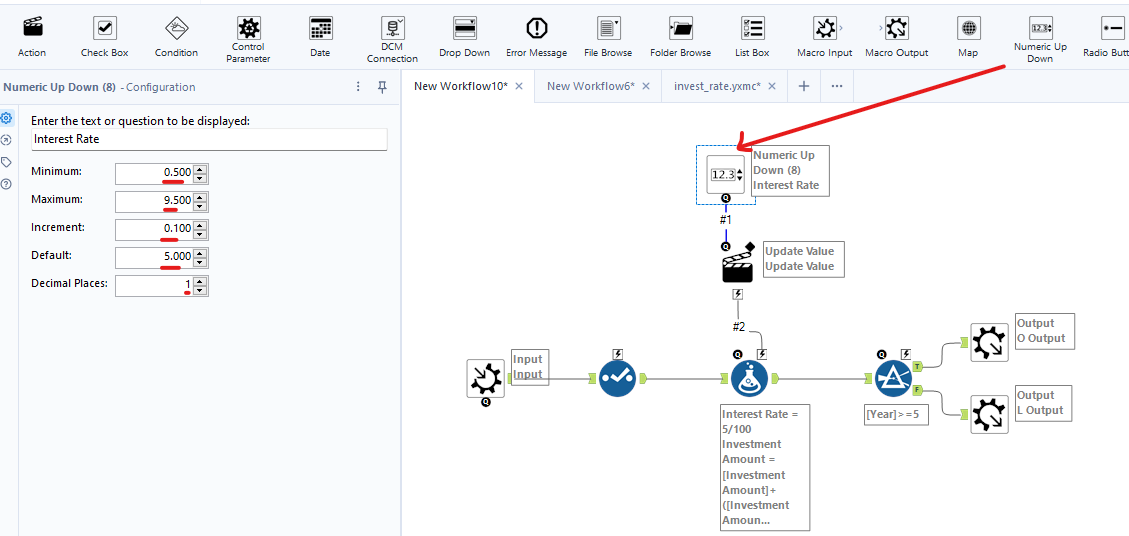
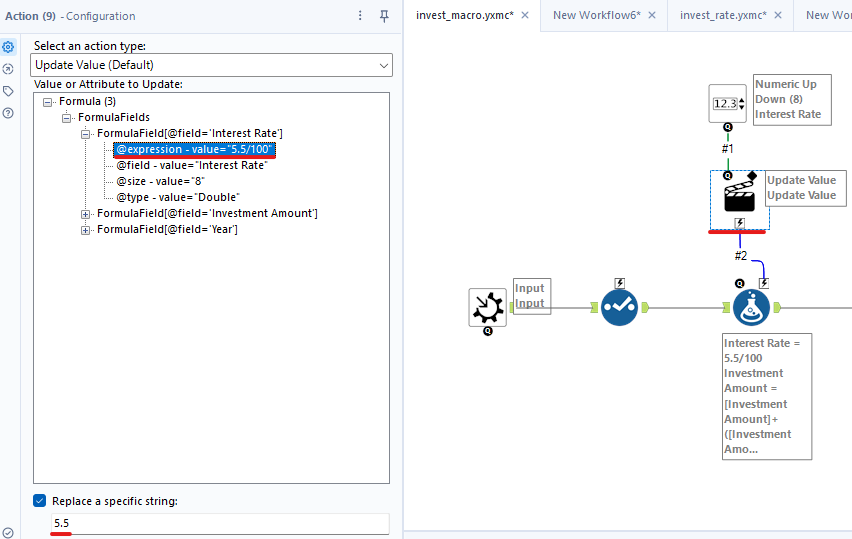
Then, I connect the Q of the Numeric Up Down tool to the thunderbolt of the Formula tool. The Action tool will automatically appear. I need to replace the current Interest Rate by a new number from user. So, I click on the Action tool. In the Configuration window, I expand the hierarchy. Then, select @expression-value = "5.5/100" row because that is the value I want to change. In the check box below, I check the box Replace a specific string and only keep value 5. It means I want to replace only the number 5.5 by a number from the Numeric Up Down tool (Image 10).
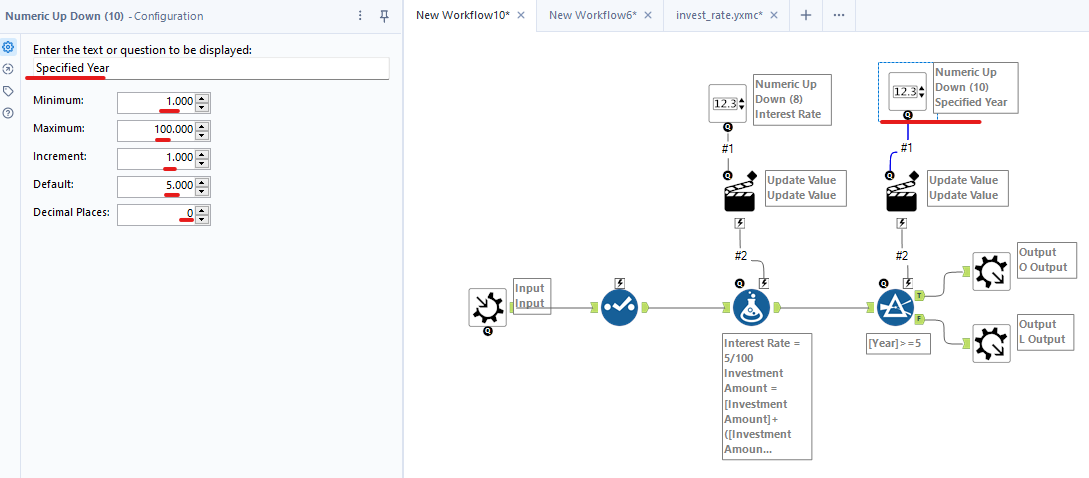
I did the same for the Specified Year. Currently, I set the condition Year>=5. Number 5 is the specified year by default. I want to let the user change it. I also use the Numeric Up Down tool to connect to the Filter tool from Q to Thunderbolt. By click on the Numeric Up Down tool, I specified the min, max, increment, default year number (Image 11).
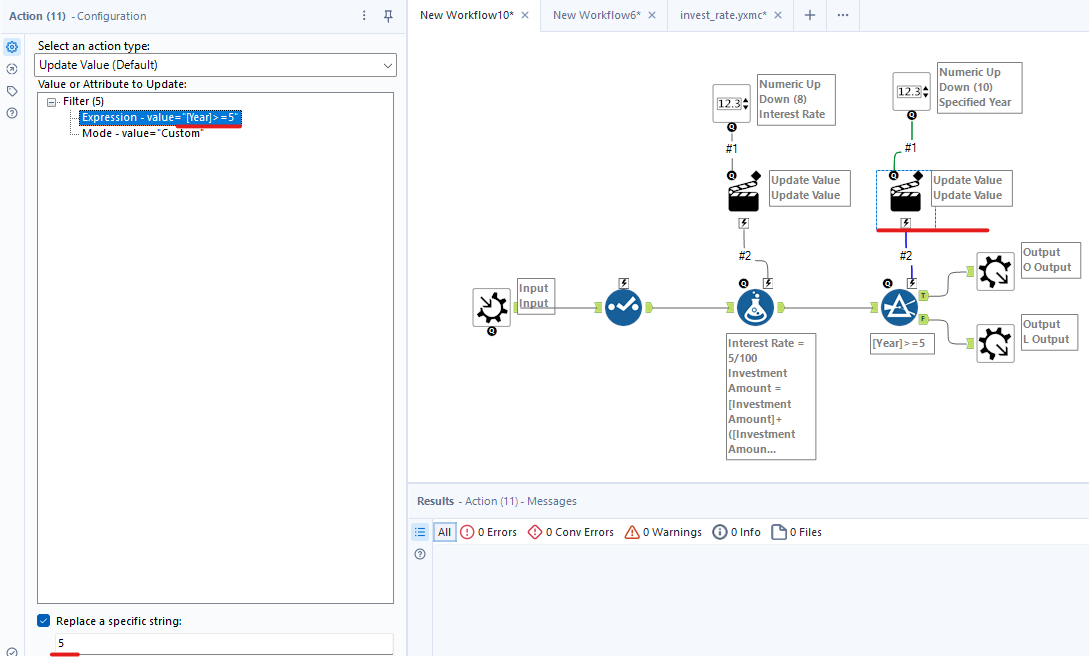
I also choose the Action tool to let Alteryx know which value should be replaced. I only replace number 5 from the Formula tool (Image 12).
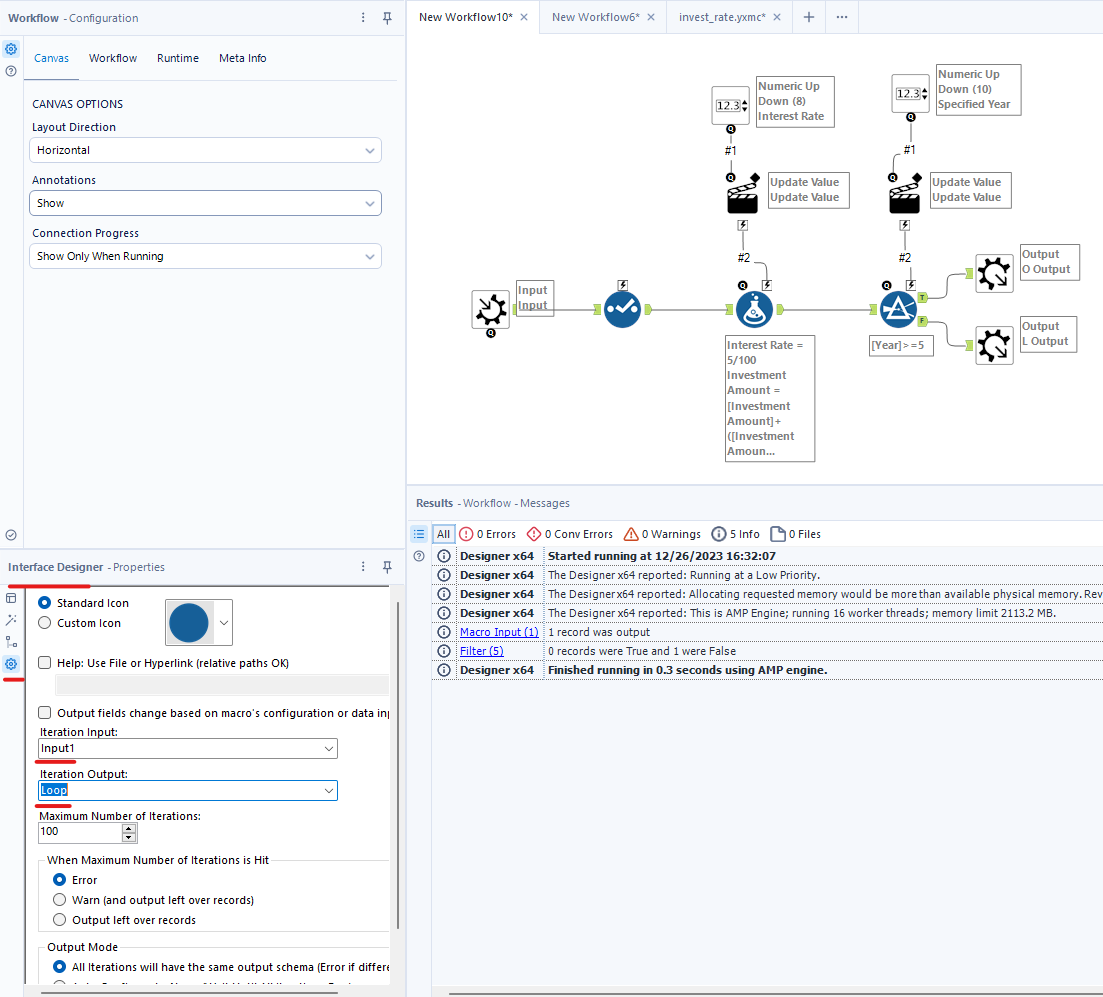
Then, I need to let Alteryx knows which tool is the Input and Iteration Loop output. So I open the Interface Designer in Alteryx by going to View/ Interface Designer (or Hold Ctrl+Alt+D). When the Interface Designer window opens, I select the Properties button on the left panel. For Iteration Input, I choose Input1. For Iteration Output, I choose Loop Output to loop the workflow if the condition is not met (Image 13).
Finally, I run the workflow and save the macro. I saved the macro as invest_macro.yxmc. After that, I open a new workflow and create a Text Input to set the Investment Amount. Then, right-click on the canvas, choose macro and select invest_macro that I just created (Image 14).
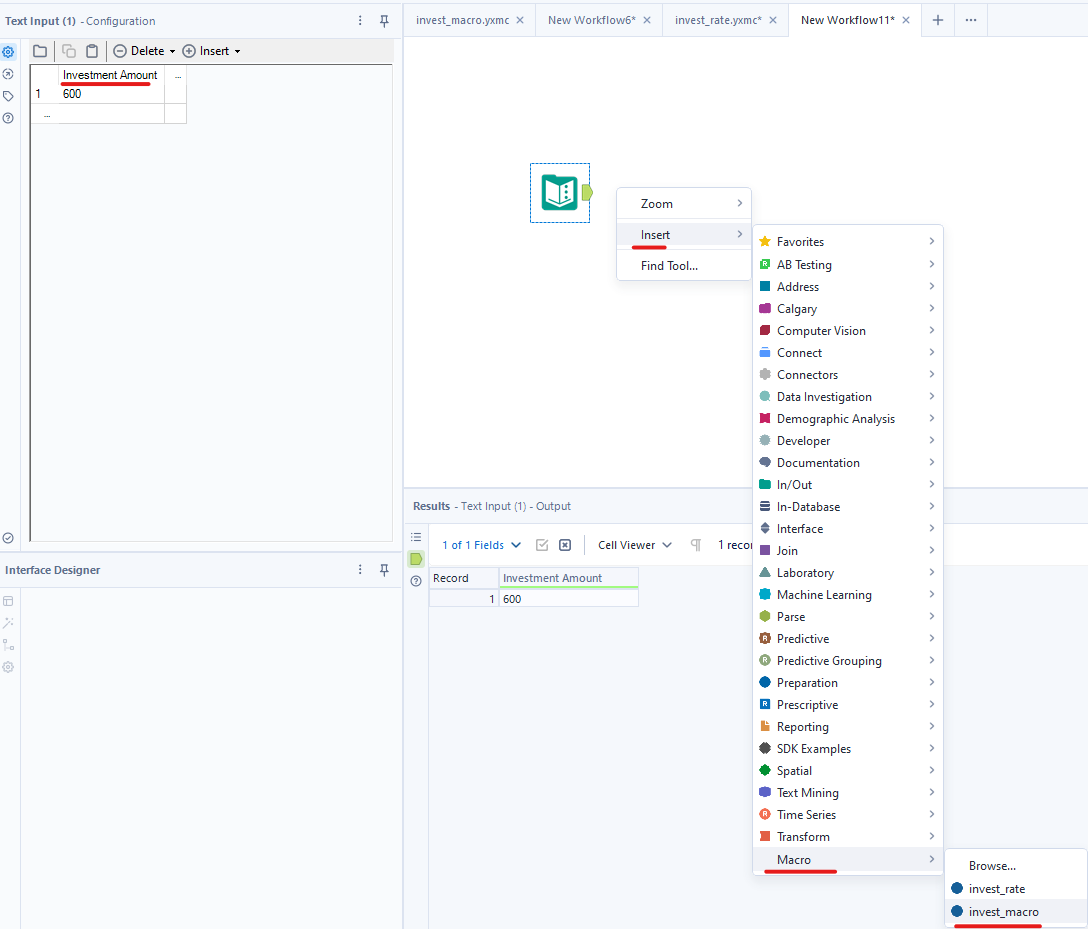
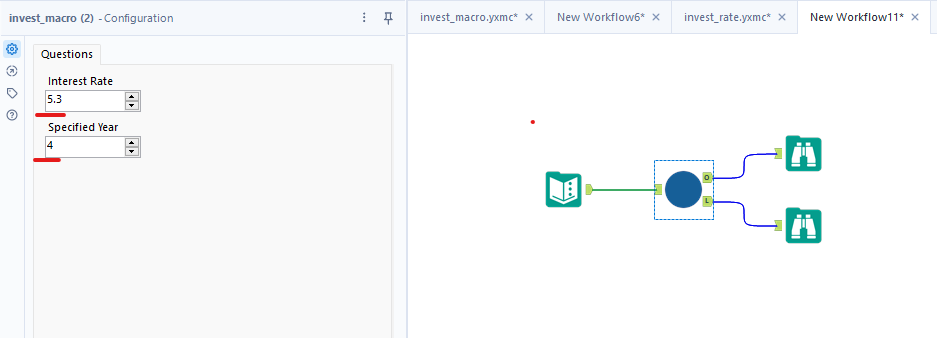
I connect the output anchors from the macro to the Browse tool to output. I click on the macro to specify the Interest Rate and Specified Year. Then, I run the workflow.
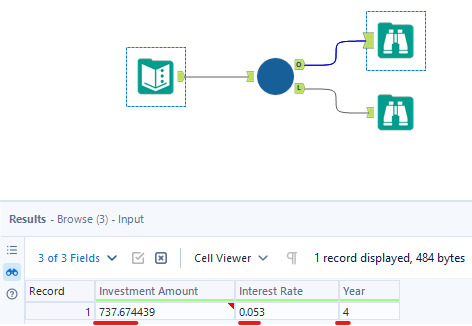
At the beginning, I invested 600. After 4 years, I got 737.674439 if the Interest Rate is 5.3% (Image 16).
However, if you want to print the result after each year, you can connect the expression to the output (same as the flow chart). (Image 17)
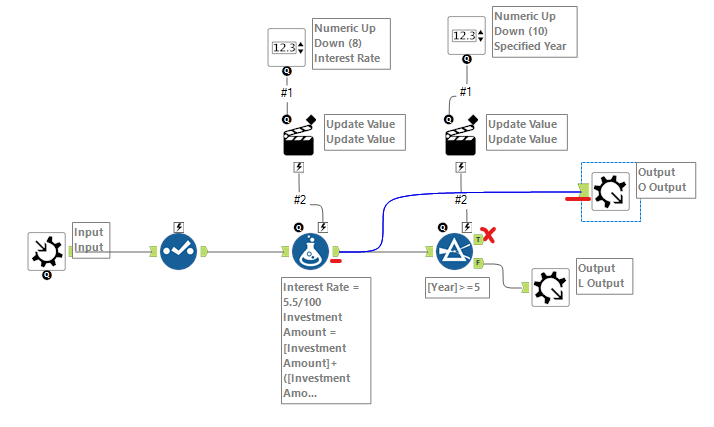
Then, run and save the macro. In the new workflow, run the workflow again. Now, I can check the Investment amount each year with the given Interest Rate (Image 18).

This blog is quite long, but I hope you get the idea how to build an Iterative Macro in Alteryx. The Iterative Macro is more difficult than other types of macro. You have to set the initial values, decide when the loop stops and if the condition is not met, what will do next. I feel the flow chart is useful to me when I sketch my idea on the paper and transfer it to Alteryx.
Thank you for reading and see you soon in the next blog!
