In the first blog of LODs in Tableau - Part 1, I introduced the definition of LOD, 3 main types of LOD expressions in Tableau, and the LOD expressions in Tableau's order of operation. In this second part, I will continue with the LOD topic. I will show some useful cases of LOD expressions in computing value in Tableau.
1/ Customer Order Frequency
2/ Cohort Analysis
3/ Percent of Total
4/ New Customer Acquisition
5/ Comparative Sales Analysis
1/ Customer Order Frequency
Goal: I would like to know the number of orders for each customer and then summarize how many customers for each group.
I will create a calculated field for each customer to compute the order number for each customer. I need to count how many orders each customer ordered, so I use COUNTD([Order ID]) to count for each Customer Name with FIXED LOD. (Image 1)
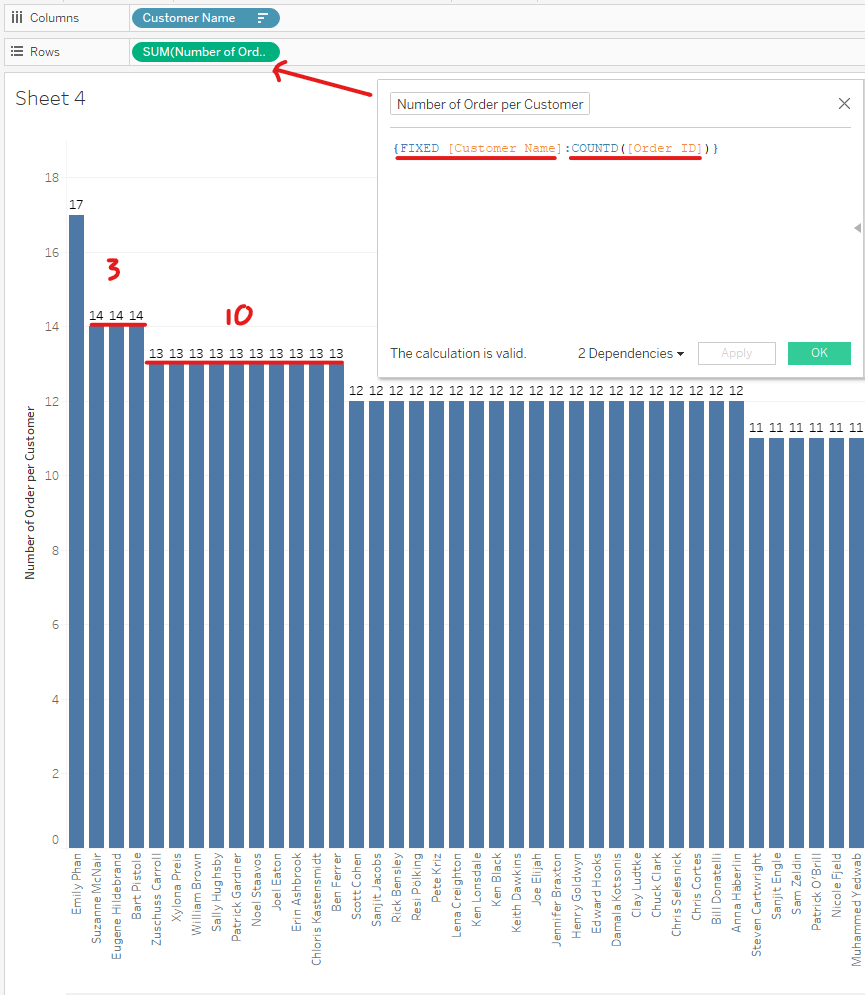
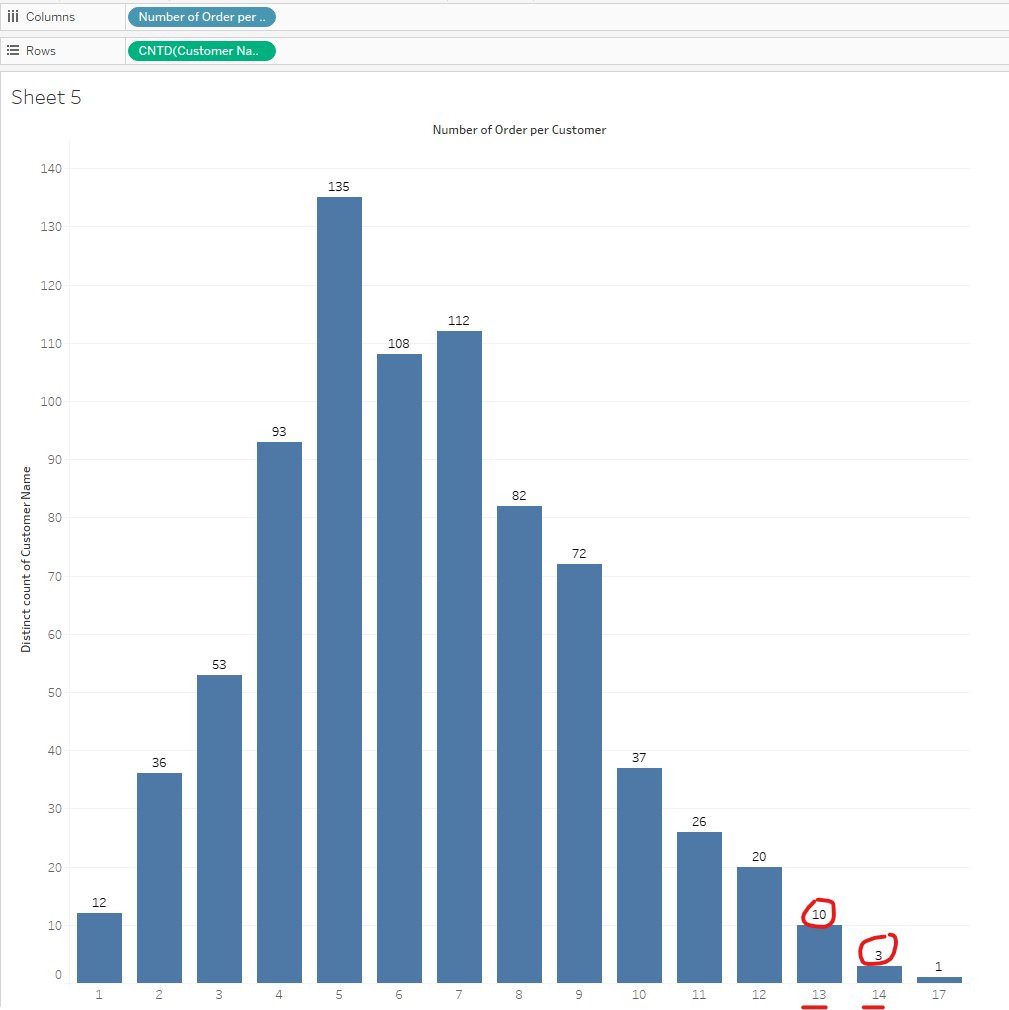
Then, drag the Customer Name to Columns and the Number of Orders per Customer into Rows. Now, I want to find the mode of the number of orders. I will open a new sheet, then drag the Number of Orders per Customer to Columns and COUNT distinct Customer Name to Rows. I get the result in Image 2 below.
2/ Cohort Analysis
Goal: For the cohort analysis, I want to know how many customers for each year.
To do that, I need to get the first purchase date of each customer. In this case, I need to use FIXED LOD to find the minimum order date for each Customer. {FIXED [Customer Name]: MIN([Order Date])} (Image 3).
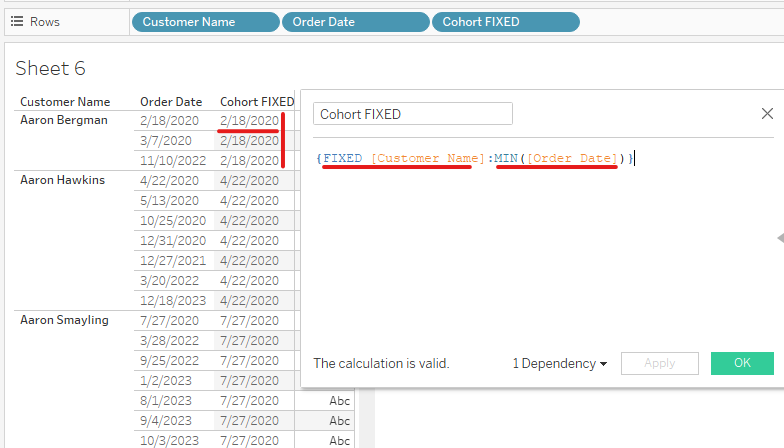
In Image 3, for the first customer, the first purchase date is 02/18/2020. After dragging the Cohort FIXED field into Rows, I got the first purchase date for each row level group by each customer name.
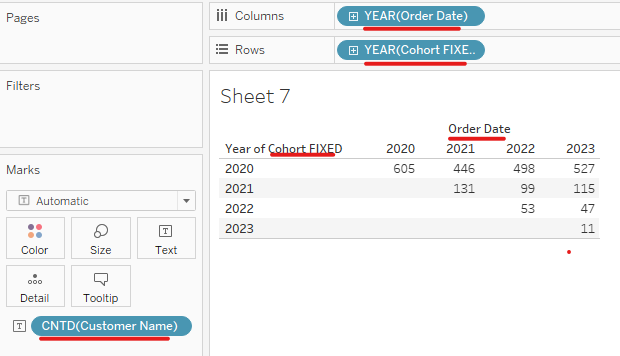
In Image 4, I drag the Order Date to Columns and Cohort FIXED into Rows. Then COUNT distinct how many customers are for each cohort by dragging the count distinct of Customer Name field into the Text mark. I got the result in Image 4. In 2020, there are 605 customers.
3/ Percent of Total
Goal: I want to calculate the percent of the total sales for each subcategory.
To calculate the percent of total sales for each sub-category, I need to find the total sales of all categories first. In this case, I use FIXED LOD to calculate the sum of sales of all dimensions in the view. Therefore, my FIXED LOD expression is {FIXED : SUM([Sales])}. We can eliminate the FIXED word in the expression, it's also the same. It would become {SUM([Sales]}. (Image 5)
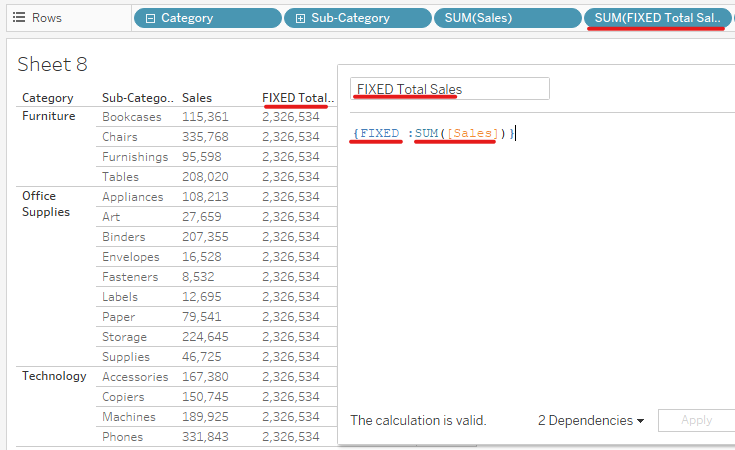
After getting the Total sales for all categories, now I can create a calculated field to compute the percent of the total for each sub-category.
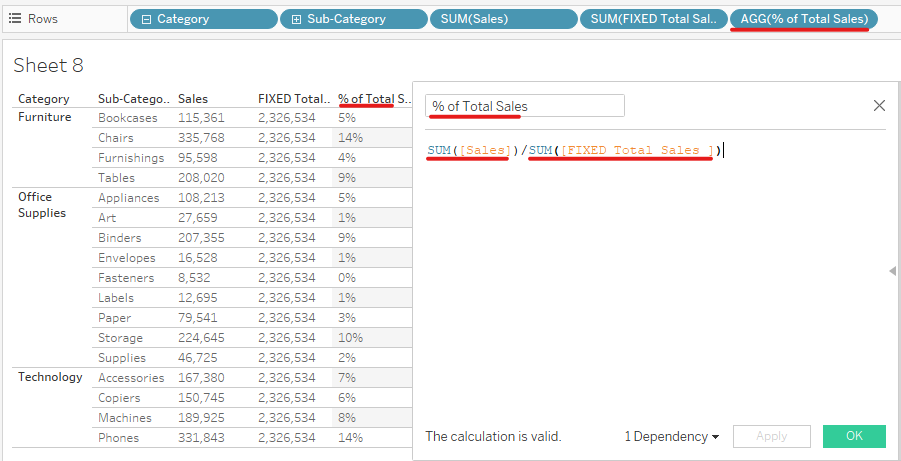
To calculate the percent of total sales for each category, I divide the sum of sales of each sub-category by the total sales that I calculated above. I created a calculated field for % of Total Sales. The expression would be SUM([Sales]) / SUM([Fixed Total Sales]) for each row level. Finally, format the result value by percentage number.
4/ New Customer Acquisition
Goal: I want to summarize how many new/ existing customers are in each year.
To start with this goal, I need to find the first purchase date of each customer. The beginning steps are the same as the cohort analysis.
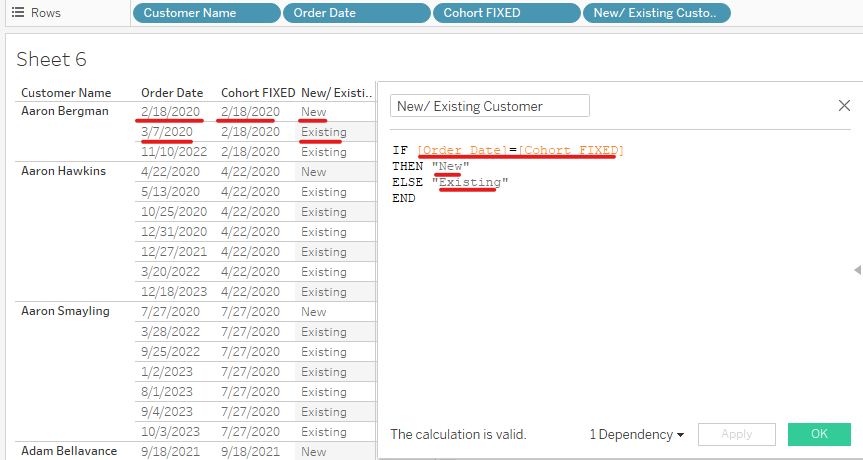
After getting the first purchase date, I want to decide if the customer is new or old. I created a new calculated field called New/ Existing Customer. If the order date is the same as the first purchase date, then that customer is new; otherwise, that's an existing customer.
Then, I create a new sheet and put the New/ Existing Customer field into Filter to filter only New customers. In Columns, I drag the continuous Day of Order Date, Count distinct customer Name in Rows, and right-click to choose Running Total. I can drag the Region field into the Color mark to compare the number of customers in each region.

5/ Comparative Sales Analysis
Goal: Find the different amount of sales for each sub-category if choosing a specific sub-category.
For this task, I need to get the sales value whenever I choose a sub-category first. To do it, I create a parameter called Choose Sub-Category Parameter, then load all sub-category values in. Then, I create a calculated field to compare if the sub-category in the field is the same as the Choose Sub-Category Parameter that I chose. If it's true then I return the sale value; otherwise return 0. Then, drag that pill into Columns next to the SUM([Sales]) pill. (Image 9)
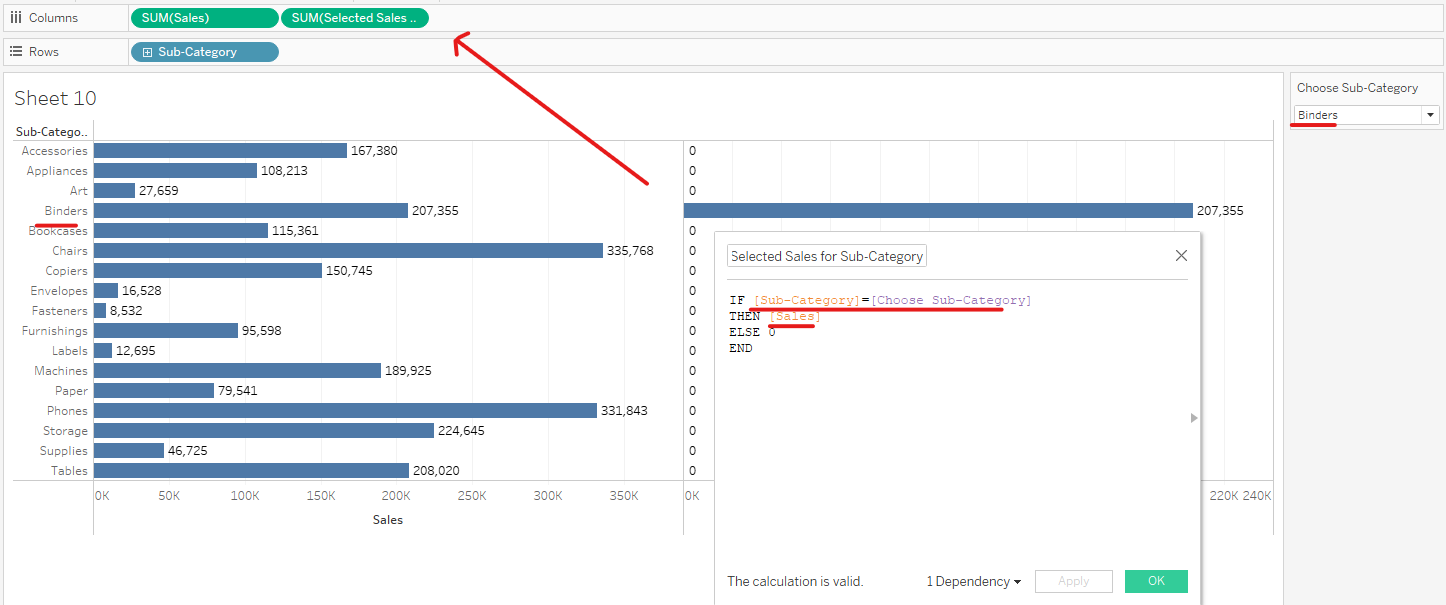
For the sub-category I chose in the parameter, it will show the sale value. The unselected sub-category values will be 0. Now, I need to compare the sale values of other rows with the sales value I selected. I have to use LOD.
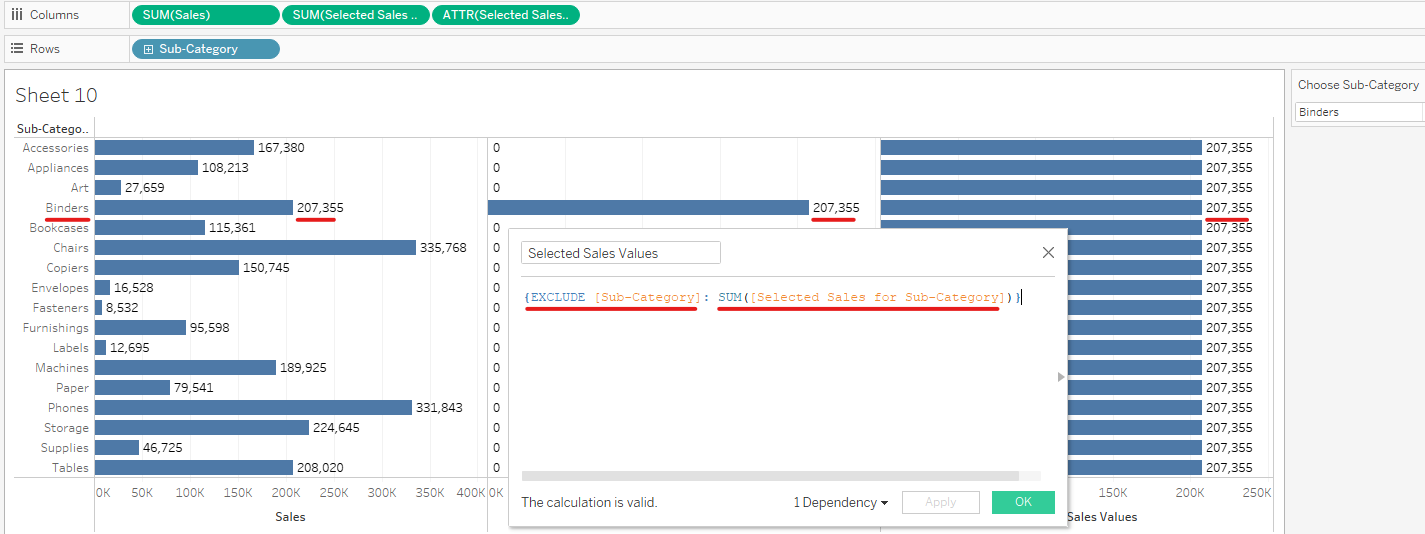
In Image 10, I created a calculated field called Selected Sales Values. It returns the Sum of Selected sales for the Sub-Category that I made earlier and excludes the Sub-Category dimension. The reason that I need to exclude the Sub-Category dimension is I need to show the selected sale value for each row. If I don't exclude the Sub-Category dimension, it will return the sale value of each Sub-Category.
Now, I can calculate the difference between each sub-category and the selected sub-category by creating a new calculated field.
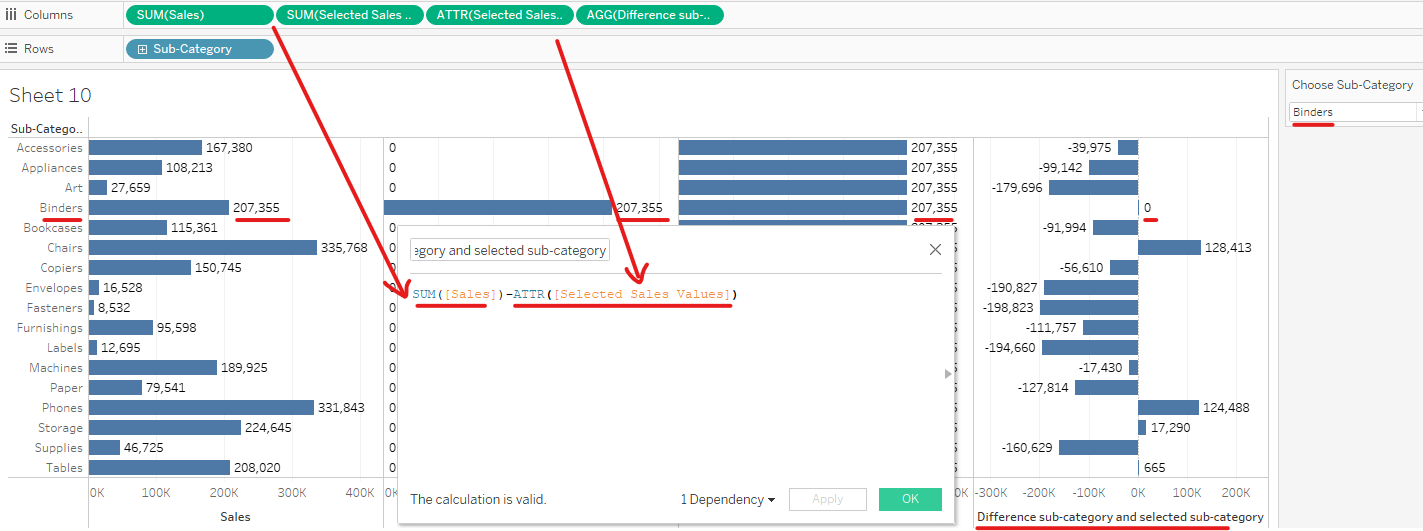
In Image 11, I created a new calculated field to subtract the sum of sales in each category with the selected sale value. In image 11, the difference sale value of the binder is 0.
In this blog, I introduced some useful cases that apply LOD expressions in computing values. There are many more useful cases that data analysts usually apply in working with data in Tableau. You can find it here. I hope this blog is helpful to you if you are working on LOD expressions or working with data.
Hope to see you in another blog soon!
