This week, we were challenged to recreate many Workout Wednesday visualisations, on either table calculations or parameters. This blog is about the former.
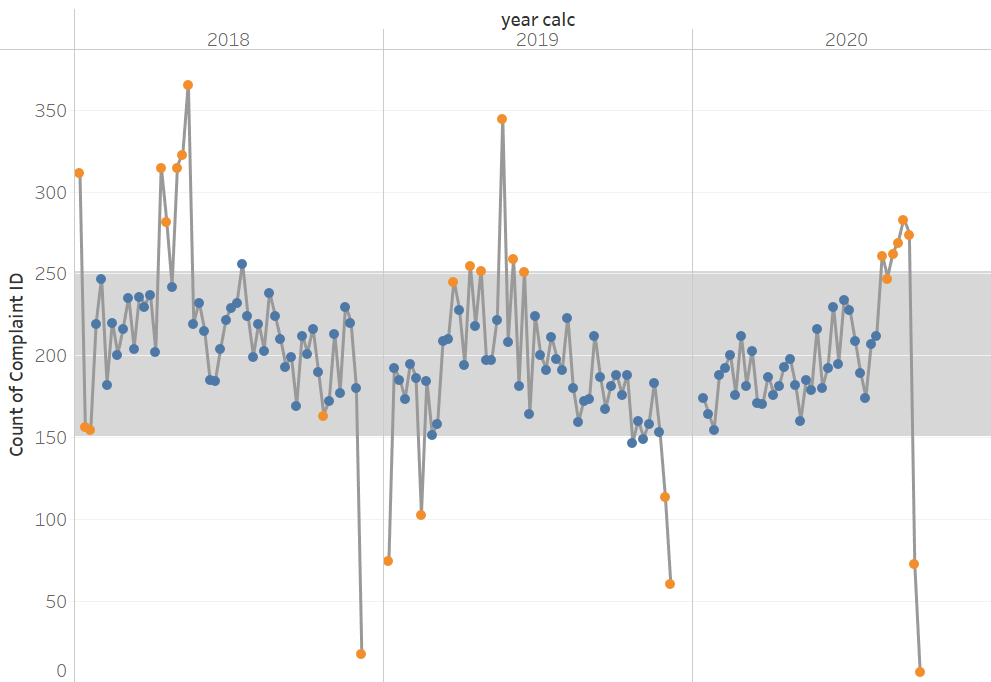
When creating Workout Wednesday 2021 week 3, I had gotten to the point were I had created the line chart with a reference band, but I couldn't understand why, after selecting cell for the scope when editing the reference band, it stayed the same for each year.

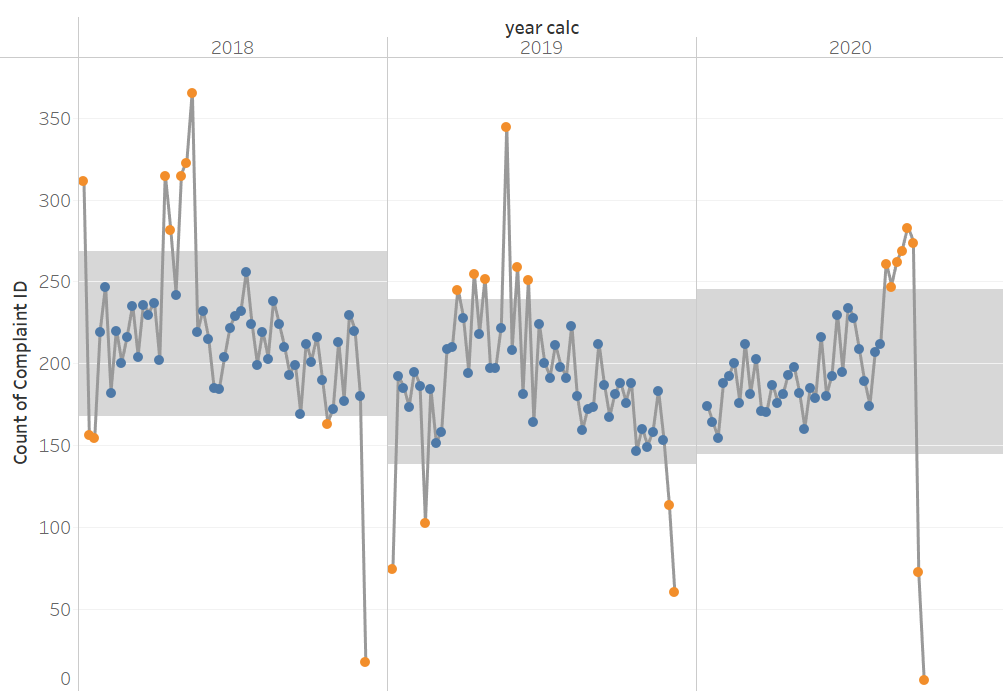
After checking my calculated fields, the edit panes, googling, trying everything I could, I remembered a previous mistake I had made in my last Workout Wednesday. When using any of the 'WINDOW_' tools, you have to configure them using 'Edit Table Calculation...' on the pills of the calculated field, after right clicking. You also have to remember, not only to configure that calculated field, but any of the others that have been inputted to that calculation. You can do this using the drop down menu, at the top of the window.

Making sure to configure all of the nested calculations for every 'table calculation' will save you a lot of time and effort.
This is what the final chart will look like after configuring correctly:

