


Last week was Power BI week, and what a whirlwind that was! As someone more used to working in Tableau, it took some time to wrap my head around how Power BI treats data differently.
One thing that tripped me up at first was the idea of calculated columns vs measures, and how row context and filter context actually work behind the scenes.
Here’s a breakdown of what I learned and how it finally started to make sense.
What Are Calculated Columns?
A calculated column is a new field you add to your data table. Power BI runs the formula for every row, creating a value for each record. These results are stored in memory as part of your data model, so the column becomes a permanent field you can use for filtering, slicing, and building visuals.
Let’s use this Sales table as an example.
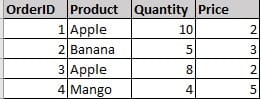
If you want to see the revenue per sale you create a calculated column:
Revenue = Sales[Quantity] * Sales[Price]
Now your table has a new column with revenue calculated for all orders
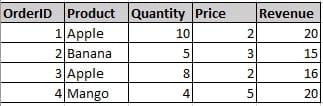
This result is now stored permanently in your data model with one new value per row.
Using a calculated column is like saying: “Add a new field to my table.”
What Are Measures?
A measure is a dynamic calculation that Power BI works out on the fly. It isn’t stored in your data model like a column, instead, it’s recalculated every time you interact with your report. This makes measures ideal for calculating totals, averages, and KPIs that instantly adjust to whatever filters or slicers you apply.
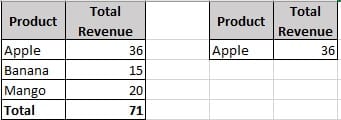
To see it in practice let’s create a new measure to show the total revenue for each product
Total Revenue = SUMX(Sales, Sales[Quantity] * Sales[Price])
The data for the new measure Total Revenue based on Products would look like this:
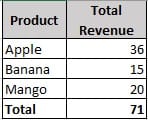
This result isn’t saved in your data model. You’ll only see it when the measure is placed in a visual, where Power BI calculates it in real time.
Using a measure is like saying: “Calculate this dynamically when I look at the data.”
The distinction between columns and measures in simple terms:
- If you need the to see the result for each row, use a calculated column.
- If you need the result summarised or aggregated, use a measure.
Understanding Row vs Filter Context
Here’s where things often get confusing — how do filters affect these calculations?
Power BI evaluates formulas in two types of contexts:
- Calculated columns operate in row context, meaning each calculation runs for individual rows.
- Measures operate in filter context, meaning calculations depend on the filters currently applied in your report.
Calculated Columns - Row Context
A calculated column is computed once per row during data load or refresh.
Filters in visuals or slicers don’t affect how it’s calculated, they only affect which rows are displayed.
Using the example from earlier:
Revenue = Sales[Quantity] * Sales[Price]
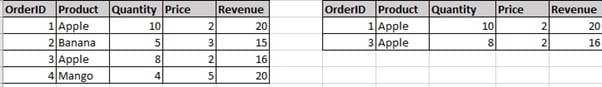
If you later filter by “Product = Apple,” it doesn’t recalculate the column. It will just filter the already calculated values for Apple. Filters decide which rows you see, not how they were calculated.
Measures - Filter Context
Measures are calculated at query time, based on the filters active in your visual or slicer. When you filter or slice, Power BI recalculates the measure within that filter context.
Using the example from earlier:
Total Revenue = SUMX(Sales, Sales[Quantity] * Sales[Price])
Filtering on “Apple,” Power BI only shows Apple rows, then runs the calculation. If you change the filter to show “Banana”, Power BI recalculates instantly.
Order of Evaluation
Here’s how DAX logically processes things:
- Filters are applied (from visuals, slicers, relationships).
- That creates a filter context.
- DAX then evaluates the measure within that filter context.
To put it simply:
Calculated Columns are static, row-by-row results stored in your model and calculations are not affected by filters or slicers.
Measures are dynamic calculations, created on the fly, that respond to filters and visuals.
The Magic of CALCULATE()
The CALCULATE() function allows you to modify or override filters directly within a measure, making it one of the most powerful and essential functions in DAX.
Example:
Revenue for Banana = CALCULATE([Total Revenue], Products[ProductName] = "Banana")
Here, Power BI ignores the current filters and applies Product = Banana instead. That’s why CALCULATE() is an invaluable tool in Power BI.
In Summary
When in doubt:
- Use calculated columns when you need new data fields.
- Use measures when you need calculations that adapt to your report’s filters and context.
Once this clicks, you’ll find DAX and Power BI start to make a lot more sense, and you can use them with far more confidence and control.