


When working in Tableau, we often rely on the fields placed on the Rows, Columns, and Marks shelves to determine the level of detail in a visualisation. But real-world analysis frequently requires us to compare numbers calculated at different levels of granularity within the same view. This is where Fixed Level of Detail (LOD) expressions become invaluable. In this post, we’ll look at what Fixed LODs are, why they matter, and how to create them in three different ways using both Tableau Desktop and Tableau Prep.
Understanding Granularity
Before we dive into LODs, let’s talk about granularity.
Granularity simply means the level of detail in your data:
- Fine granularity = very detailed (e.g., every order or transaction)
- Coarse granularity = summarised (e.g., total sales per category)
Think of it like zooming in or out on a map:
- Zoom in → individual streets (fine detail)
- Zoom out → cities or countries (summarised)
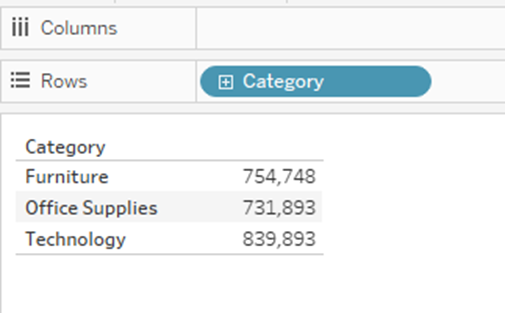
In Tableau Desktop the granularity of a visualisation is determined by the dimensions in the view. Let’s take the Superstore Sales data as an example:
- If you place Category on Rows, you’re looking at sales by category.
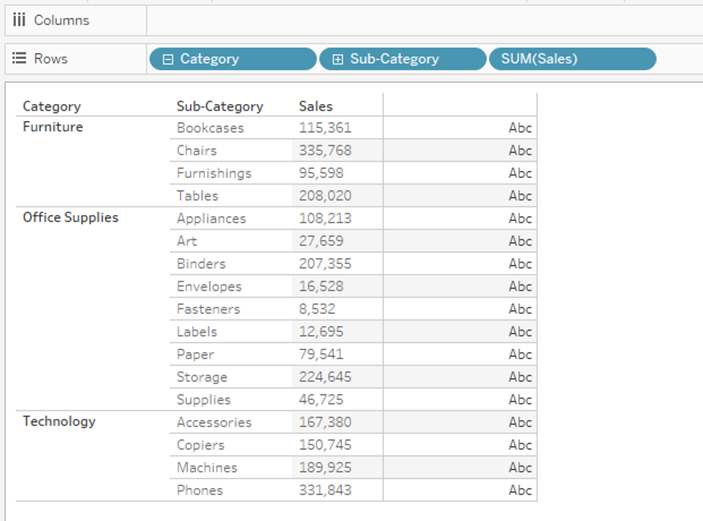
- Add Sub-category, and you’ve increased the granularity to sales by subcategory by category.
But sometimes, you want to calculate a metric at a different level of detail from your view, and that’s what LODs do.
What Are LOD Expressions and Why Might You Need Them?
LOD (Level of Detail) expressions give you a way of controlling the granularity of your data independent of the view in Tableau.
Normally, Tableau aggregates data based on what’s in the view (the dimensions and measures you’ve placed on Rows, Columns, Marks, etc.). But with LOD expressions, you can override that behaviour to compute values at a specific level of detail, regardless of what dimensions are in the visualisation.
We might want to do this in order to compare and contrast numbers at different levels of granularity in the same viz.
Let’s run through an example using our Superstore data and see the sales by category
If we add subcategory to the row, the sales figures breakdown by subcategory.
But what if we still want to see the category sales figures and even create a calculation with it e.g. show the percentage of each subcategory that makes up the category sales. This is where a FIXED LOD Expression will be needed.
FIXED LOD Expressions can be created in a number of ways either at the Tableau Desktop level or at the data preparation level using Tableau Prep.
Creating a Fixed LOD in Tableau Desktop
Fixed LODs in Tableau desktop are created using a calculated field and we use the following syntax to create our Fixed Category Sales data.
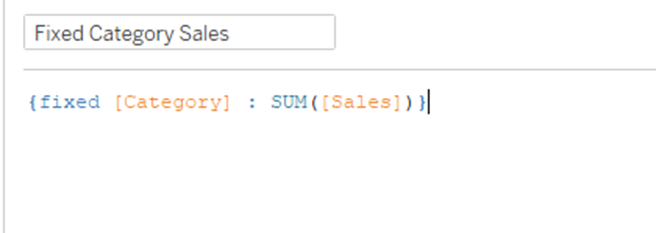
This tells Tableau to fix the level of detail on the category dimensions, and sum the sales values.
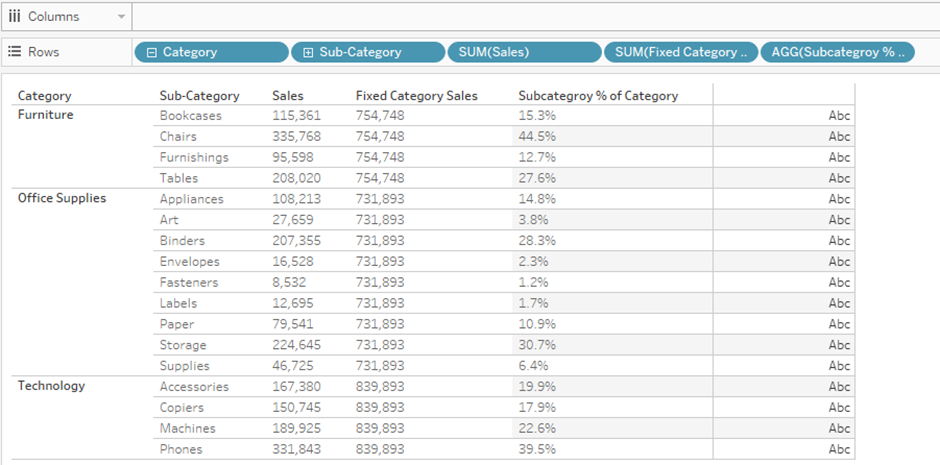
If we then drag this new field into view we can now see the category sales as well as the subcategory sales.
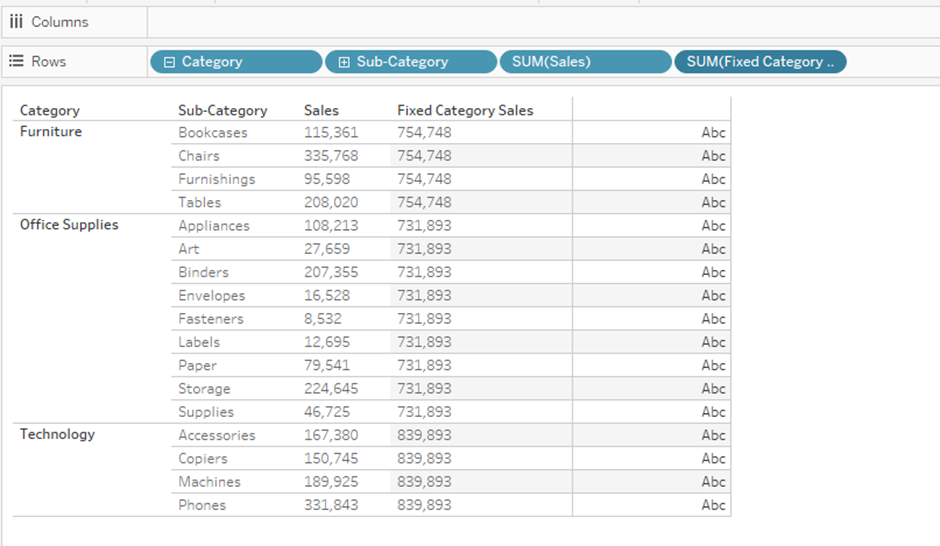
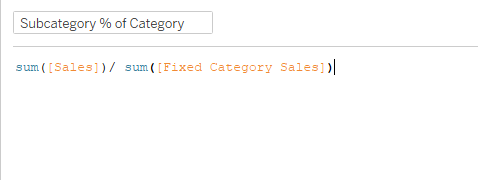
We can also extend this example by using the new field to show what percentage of the category’s sales comes from each subcategory great real-world demonstration of why Fixed LODs are so useful.
Replicating Fixed LODs in Tableau Prep
Everything we’ve done so far has been inside Tableau Desktop, but you can also create fixed level calculations during data preparation, controlling the granularity before it reaches Tableau Desktop. Tableau Prep gives us two different ways to do this.
To create our category and subcategory table as in our previous example:
Method 1:
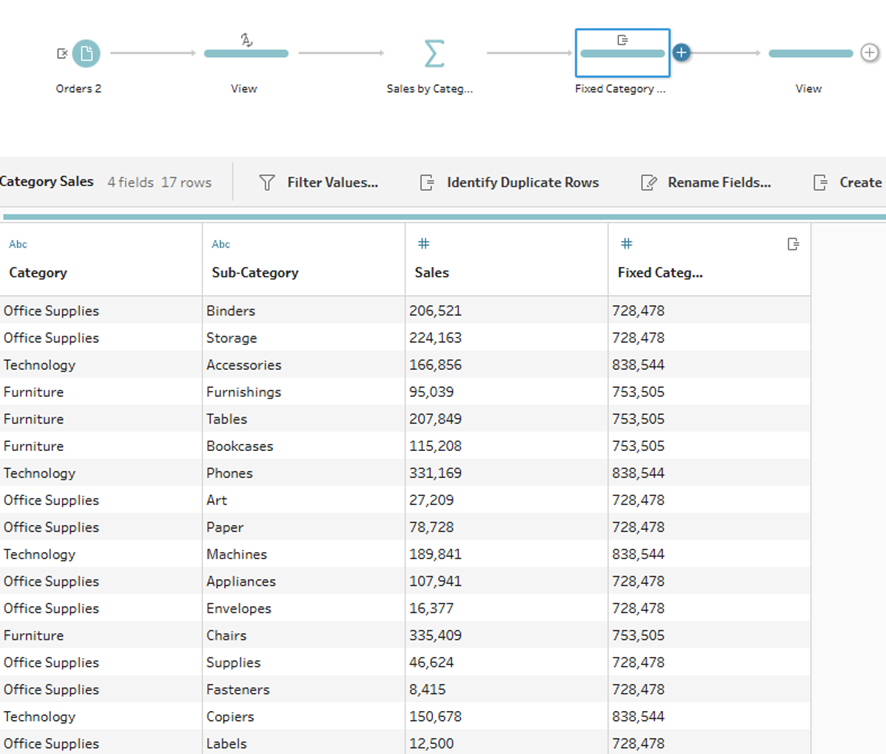
We first create 2 separate aggregated tables, one for category sales, and one of subcategory sales.
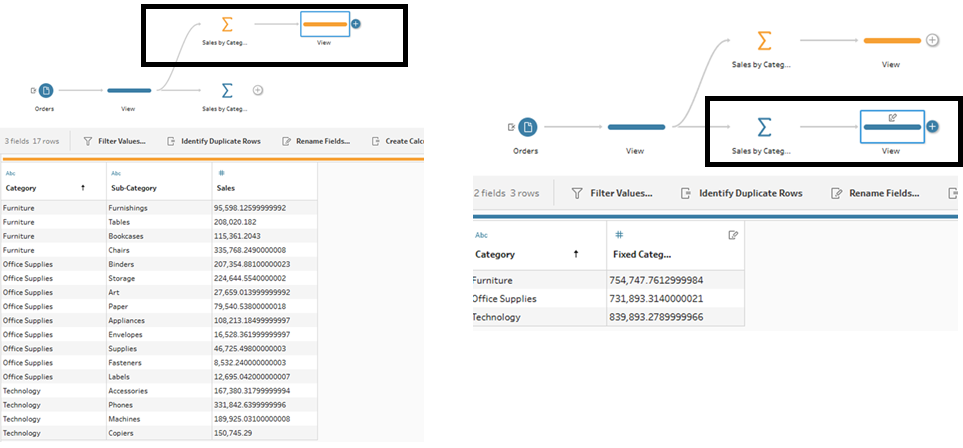
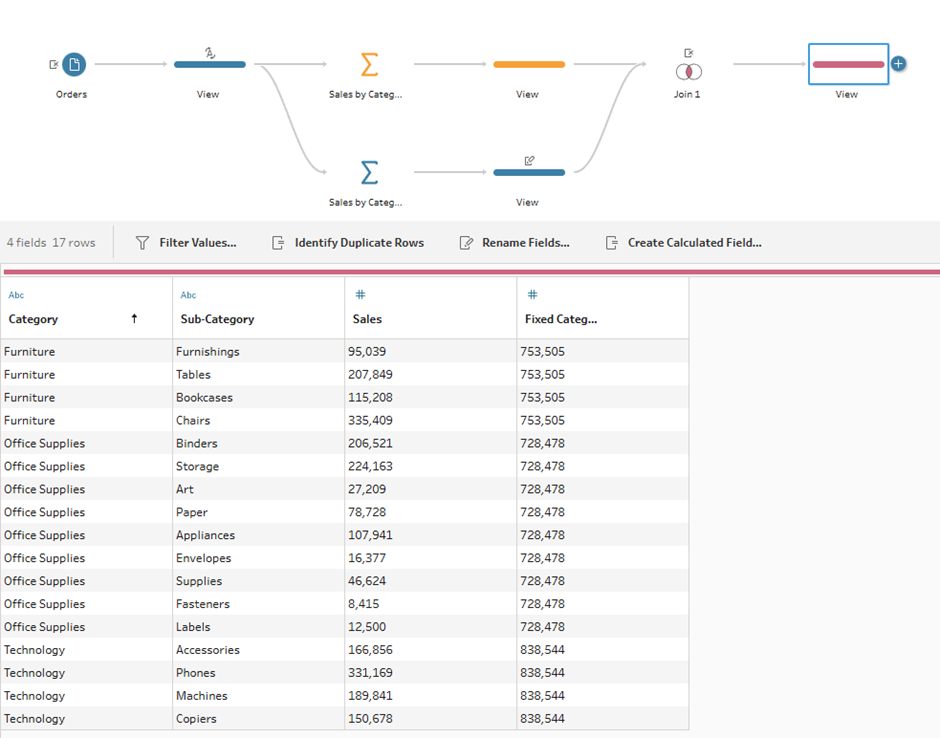
And then join them back together to get our final table.
Method 2:
While Method 1 is effective, it seems a little convoluted, and thankfully Tableau Prep has a built in Fixed LOD calculated field function that will streamline the process. Simply click on the ellipsis menu of the field you want to fix, select the FIXED LOD option from the Create Calculated Field menu.
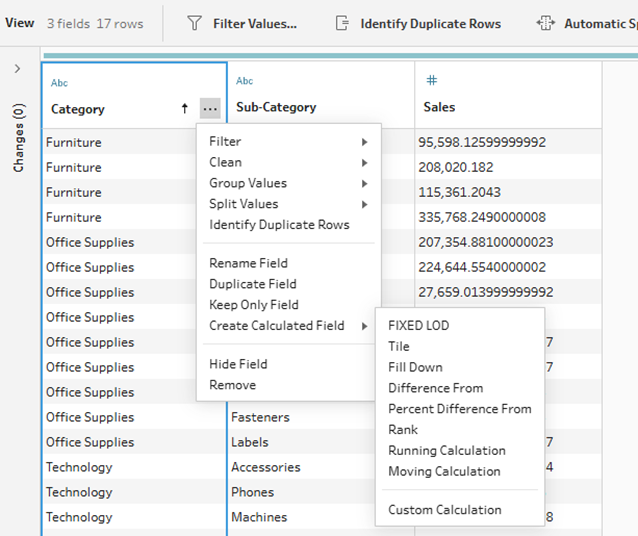
Choose your values field and method of aggregation.
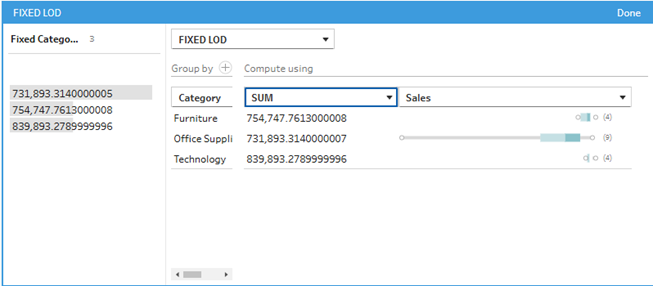
And voila. A fixed LOD in Tableau Prep in far fewer steps than the previous method.
Conclusion
Fixed LODs are one of Tableau’s most powerful tools for controlling how data is aggregated, regardless of what is displayed in the view. Whether you create them directly in Tableau Desktop or build them upstream in Tableau Prep, the ability to lock calculations to a specific granularity opens the door to more flexible and accurate analysis.