Today we talked about Spatial in Tableau and Alteryx for the first time. In both tools, there are great many ways to analyze the locations, relationships, attributes, and approximations in geospatial data to gain insights using geographic modeling. Spatial analytics allows organizations to combine geographic and descriptive data from a variety of sources and use that data to create geographic models and visualizations. Through data visualization, organizations can uniquely identify spatial data points to understand where and why events occurred, determine the suitability of a location for business purposes, interpret and understand change, identify patterns, and predict outcomes.
In Alteryx there are many tools that can be used for this purpose and help for your data prep:

Today we are working with the:
Create Points Tool
The Create Points tool creates a point-type spatial object by specifying input fields containing the X coordinate (Longitude ) and the Y coordinate (Latitude ).
Make Grid Tool
The Make Grid tool takes a spatial object and creates a grid. The resulting grid is either a single grid, bound to the extent of the input spatial objects, or individual grids that dissect each input polygon.
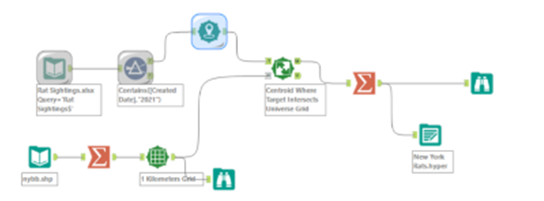
Spatial Match Tool
The Spatial Match tool establishes the spatial relationship (contains, intersects, touches, etc) between two sets of spatial objects. The tool accepts a set of spatial objects from the Left Input (Targets) and a set of spatial objects from the Right Input (Universe ).
Poly-Build Tool
The PolyBuild tool takes a group of spatial point objects and draws a polygon or polyline in a specific order to represent that group of points.
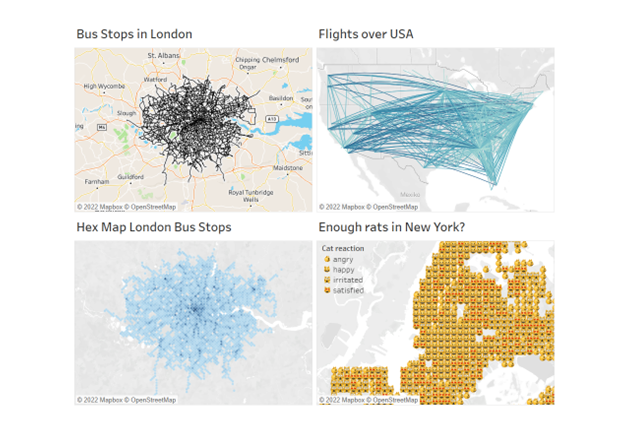
But you can also have fun with special Spatial, this was the Worflow about the satisfaction of cats in New York. Parameter was here whether there are enough rates in the area or not.
The short insight into the infinite possibilities with spatial. Especially in the field of data visualization my interest has been aroused and I am looking forward to more input.