


I underestimated myself today. The task didn't sound doable to me. I haven't worked with Mockaroo or Power Bi, and I thought I'd never get it done in a day, but I did.
But let's get to the task first:
Pick an industry, build your own data set using Mockaroo, create a KPI dashboard and using Power BI
Data MUST include: Time series, at least 3 dimensions; e.g., products, suppliers, geographical data, at least 4 measures; e.g., sales, profit, targets, etc. Demographic data about customers (so there must be customers in the data set), anything else they wish to include in their dataset
So far so good.
For those who don't know, Mockaroo is a free website for creating fake data. It is a very good platform to e.g. create data for a dashboard that has been on your mind for a long time, but you don't have the right data yet. The motto is "what doesn't fit is made to fit". However, there is one prerequisite, you must already know what data you need and what structure the data should have. So you should think about a story for your dashboard beforehand. If you have forgotten how the tool works, no problem, there are good tutorials on the Internet.
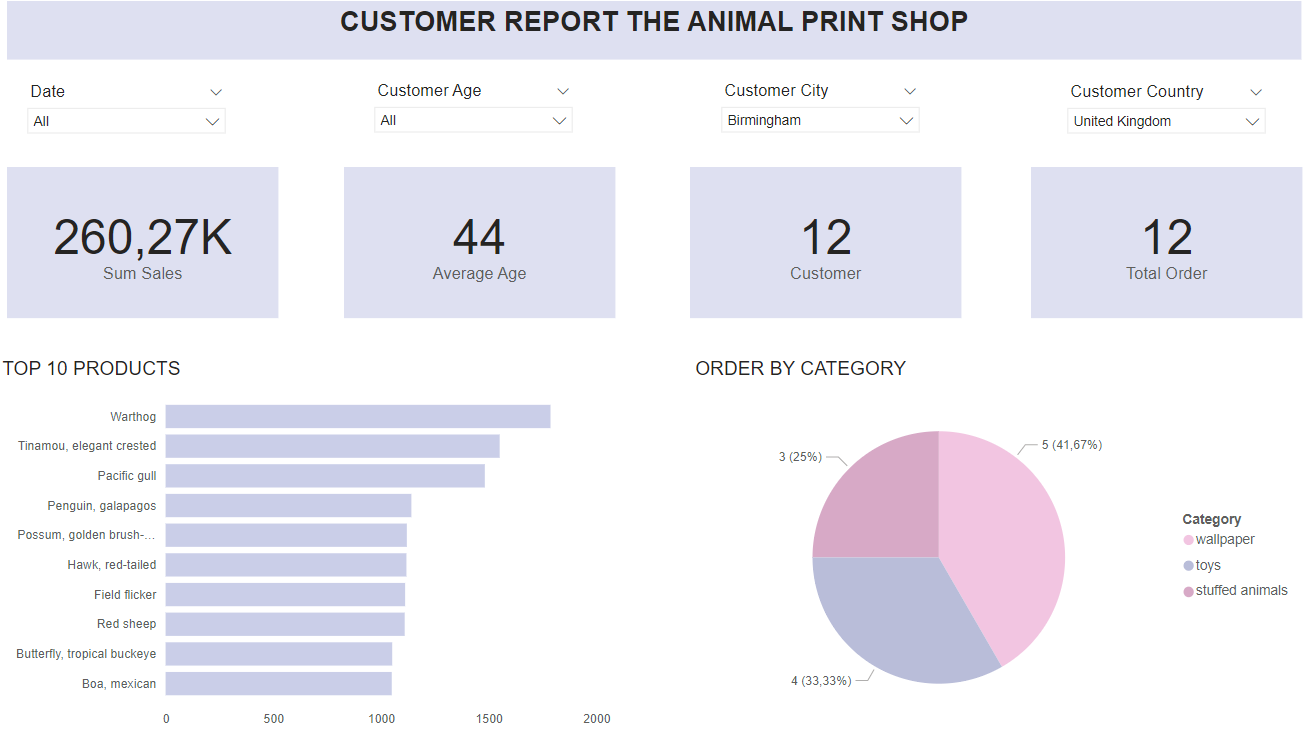
My ? I have a store for animal prints. My sales are bad and I want a dashboard to analyze my customers. My insight about my animal print store? I sell only in two countries, my customers are on average about 46 years old and I sell only three products. Wallpaper, stuffed animals and toys. Since you can't print toys or stuffed animals, I should rethink the name of my store and do more marketing overall to appeal to younger customers and think more globally. But see for yourself:
I built the dashboard in Power Bi. We had one day of training in Power BI, no more and no less. At the task this morning, I thought briefly that I can not do it. Realization after 4 months of training. I have learned a lot. I knew what I wanted to do and just had to find out where to do it in Power Bi. Where do I format text, colors, legends, where do I write my calculating fields, etc.? Power Bi is definitely not my favorite tool, but it is also very intuitive in some places, so with our experience you can quickly find an approach and have a showable result at the end of the day.
If I hadn't forgotten my story, the sketch of my dashboards and my TO DO list (resulting from yesterday's mistakes) during the presentation, it would have been an "almost" perfect day.
There comes then my favorite phrase: "Something is always"! And I'm already looking forward to tomorrow.