Long long time ago, I can still remember... or once upon a time... a series. This series ran from 2008 -2013 and was very successful, winning several Golden Globes and Emmy Awards. Why was it so popular? Firstly because of the question: how far would you go if you knew you had to die but still wanted to have money to provide for your family and secondly because of the fantastic shots, beautiful landscapes, bathed in incredible colors. Oh yes, and then there was violence, lots of violence. This was also shown in only all imaginable versions. Who doesn't remember a turtle running through the desert with the head of a drug lord! Compared to 2022, however, the series today seems more like a dinosaur.
Our task today was to create a dashboard from the API of Breaking Bad. There were no limits, the main thing is to have it ready by 4:30pm. So since it was more about Fun Data, everyone in the group tried around and got. The data set became way too dead. However, being more of a fan of the grandiose images of the series and less of a fan of the main character Walter White or his wife, I decided to make a pretty dashboard about the second main character, Jesse Pinkman. Who, unlike many others in the series, was forced to do most of the deeds and didn't handle the role of evil drug dealer as well as the rest. In short, he had a conscience.
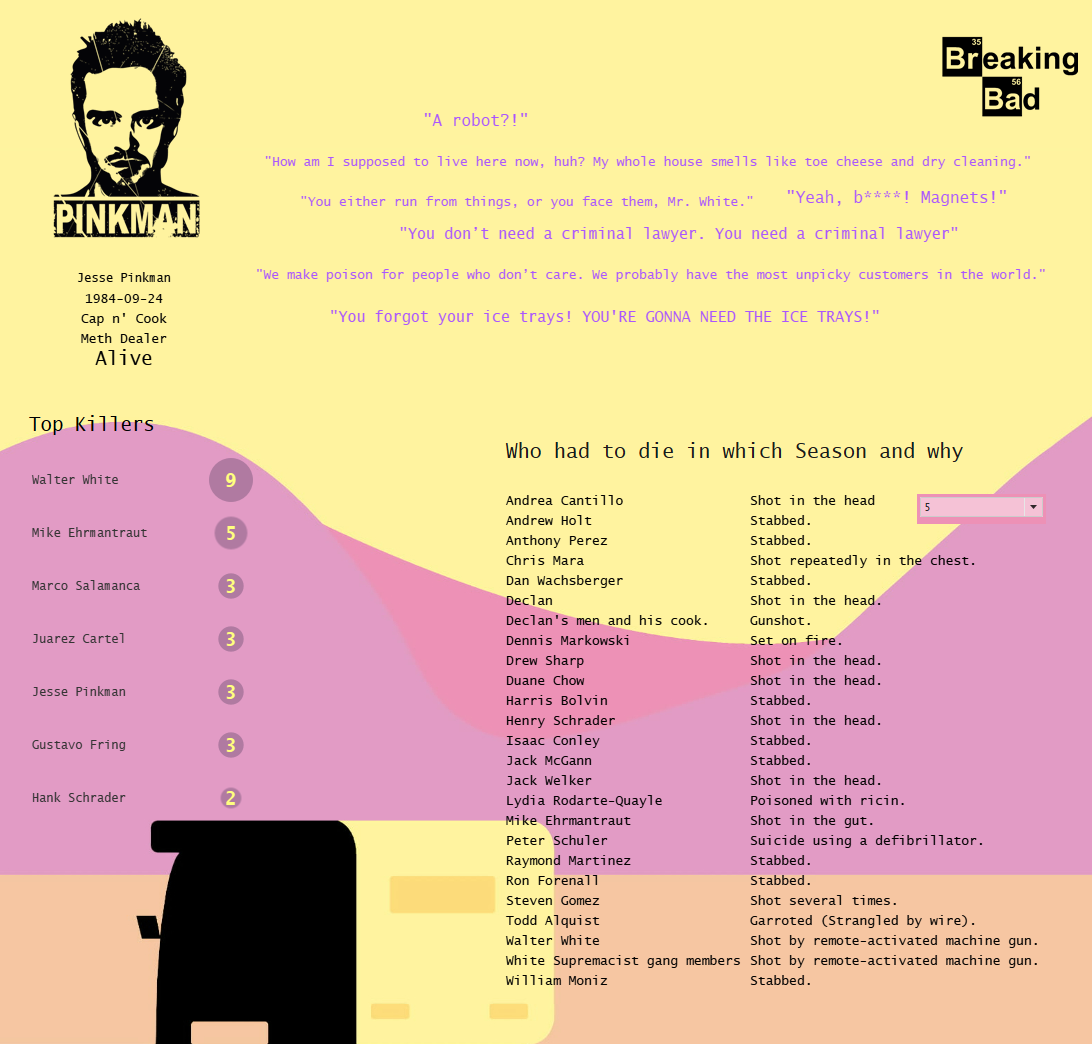
Long speech, here purely picture of my interpretation of the data:
https://public.tableau.com/app/profile/kerstin.horscht/viz/BreakingBadJessePinkman/Dashboard1