


This week my cohort (ds35) were involved in teaching the public about Alteryx and Tableau. Here is what I want to share about my experience teaching the public and how I went about planning my session.
The first thing I did was go through the content and make sure I understood the topics well enough to be able to answer any questions during the session. I did this by going through the interactive learning sessions in the Alteryx website which demonstrates the function and use case for each of the tools. https://community.alteryx.com/t5/Interactive-Lessons/tkb-p/interactive-lessons
I made sure to prioritize important content due to time limitation (I had to teach 10+ tools for Alteryx beginners in under 45 mins). This was helpful when it came to planning my session as I knew exactly what to cover.
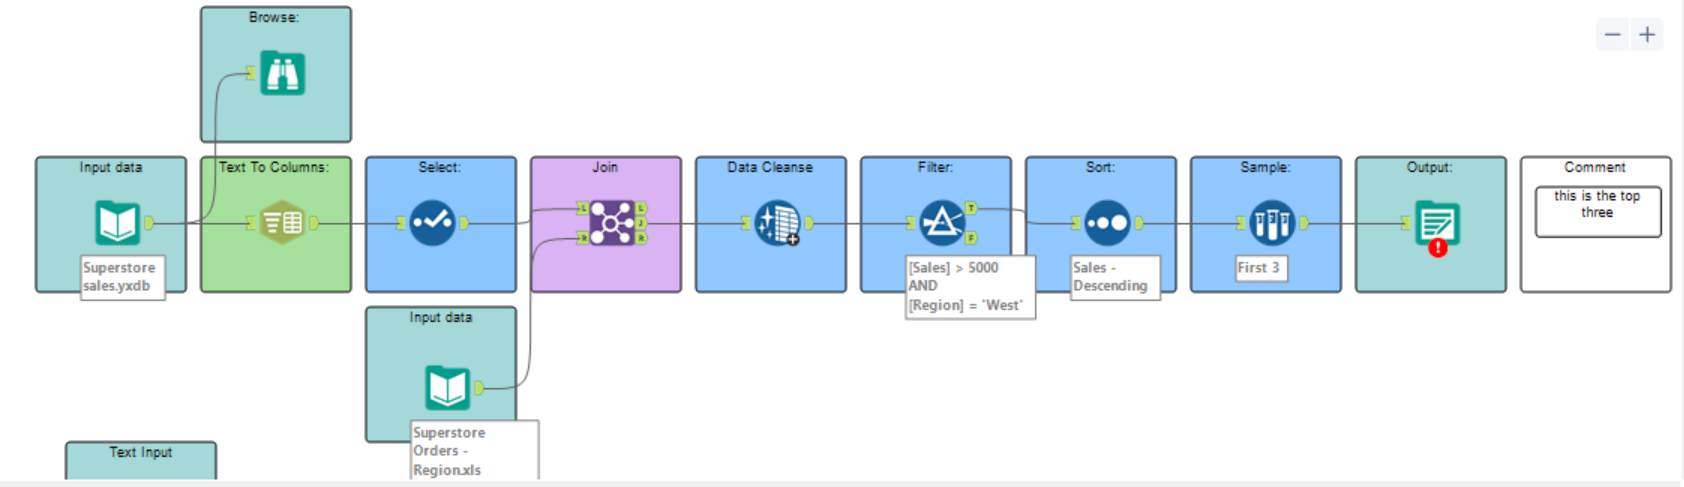
After this, I started planning my session by coming up with a way to combine all the tools from the favorites tab into one workflow. I thought this would be a useful way to introduce Alteryx in a more clear and concise way. I came up with different ways to arrange the tools which would allow them all to fit in one workflow. Once I figured out a way to do this, I had to adjust the data in order for it to be analyzed in the session as I had planned. I used the superstore dataset, making sure to change all the data types to strings, add some nulls and some errors that can be fixed with the tools covered in the session.
This was the final workflow I had created:
Once I had completed the workflow it was time for me to start planning my script and PowerPoint.
I made sure to highlight the fact that those attending the session would have little to no knowledge of Alteryx which would require a brief introduction of the configuration pane, results and canvas. I also wanted to add some slides which would visualize complex topics that I struggled with during training. For example the difference between join and union tool was shown in the slides as a diagram. As the session is only 45 minutes long, I also made sure to link in the slides any additional information that I would not have time to cover. For example, I added additional information on data types, file types and where to find extra help with the tools.
Finally, I downloaded zoom it for the session https://zoomit.en.softonic.com/ to help me clearly present the topics and zoom in on calculations or certain tools.