Often you need to add a moving average to your line chart in tableau. Sometimes it can be useful to make the moving average adjustable for the user to change.
Firstly, create your line chart. Drag the measures onto your columns and rows and change the mark type to line if it is not already.

Next, duplicate the dependent variable on the rows. Right click and select quick table calculation and moving average.

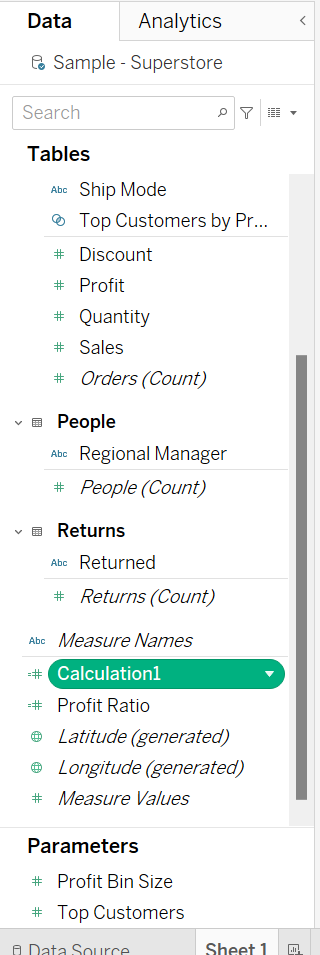
Make sure you drag this new calculation to the data pane and rename your calculation accordingly.

Next, create a parameter and name and adjust it accordingly. Here, I have adjusted mine to a integer with a range from 1-100 and a step size of 1.

Now, edit your moving average calculation and replace the -2 with the parameter as seen below.

Make sure to right click on your parameter and select 'show parameter'. You can also right click on a field on your rows and click 'dual axis' to have the 2 line charts on one axis.
Now, when you change the parameter value it should change the moving average line accordingly!
