Today, DS37 did some preparation for the Alteryx Core Certification. We were tasked with making a presentation of some of the tools we will be asked about. What do they do?
We split into groups and with our partners, we needed to give the rest of the group a short presentation on the above tools. In this blog, I will explain the tools that I presented and how they work.
Transpose
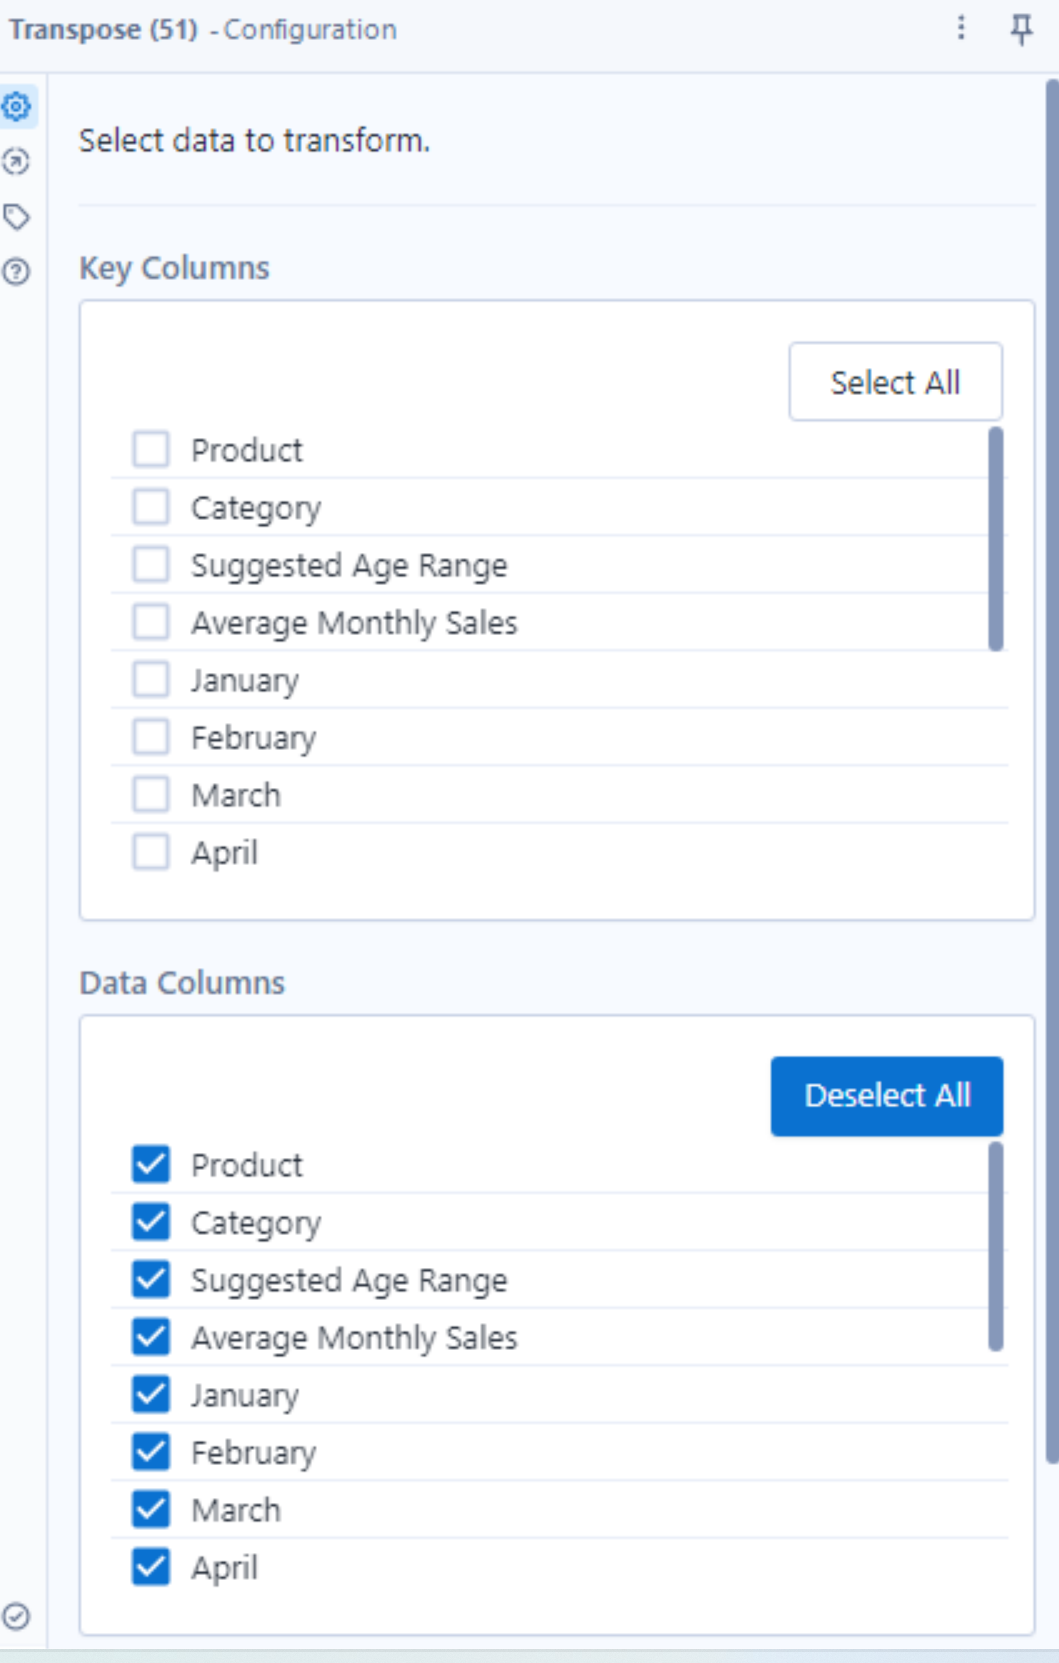
This tool can be found in the 'Transform' tab in the Alteryx tool palette. Transpose moves values held in multiple horizontal columns into a single column, essentially pivoting horizontal data to a vertical axis. Below is the configuration window of the Transpose tool. Here, the user can select which columns to keep, and which to tranpose vertically.

I used the below example to help everyone visualise what is happening once we transpose our data.
Before transposing, the data is horizontally written with each quarter taking its place in a different header, and its value below. By transposing, we want the data to be grouped by vertically, and in this case into columns. Our new columns show the value and name of each quarter for the store. It is easier to read this way.
Count Records
The next tool I demonstrated was the count records tool, which does exactly what it says on the tin - it counts records :)
This tool returns a simple count of the number of rows passing through a data stream. It even returns a count of zero, which is something that the Summarize tool doesn't do. This is simply added to the tool which records you'd like to count, and it returns how many there are within the results pane.
Text to Columns
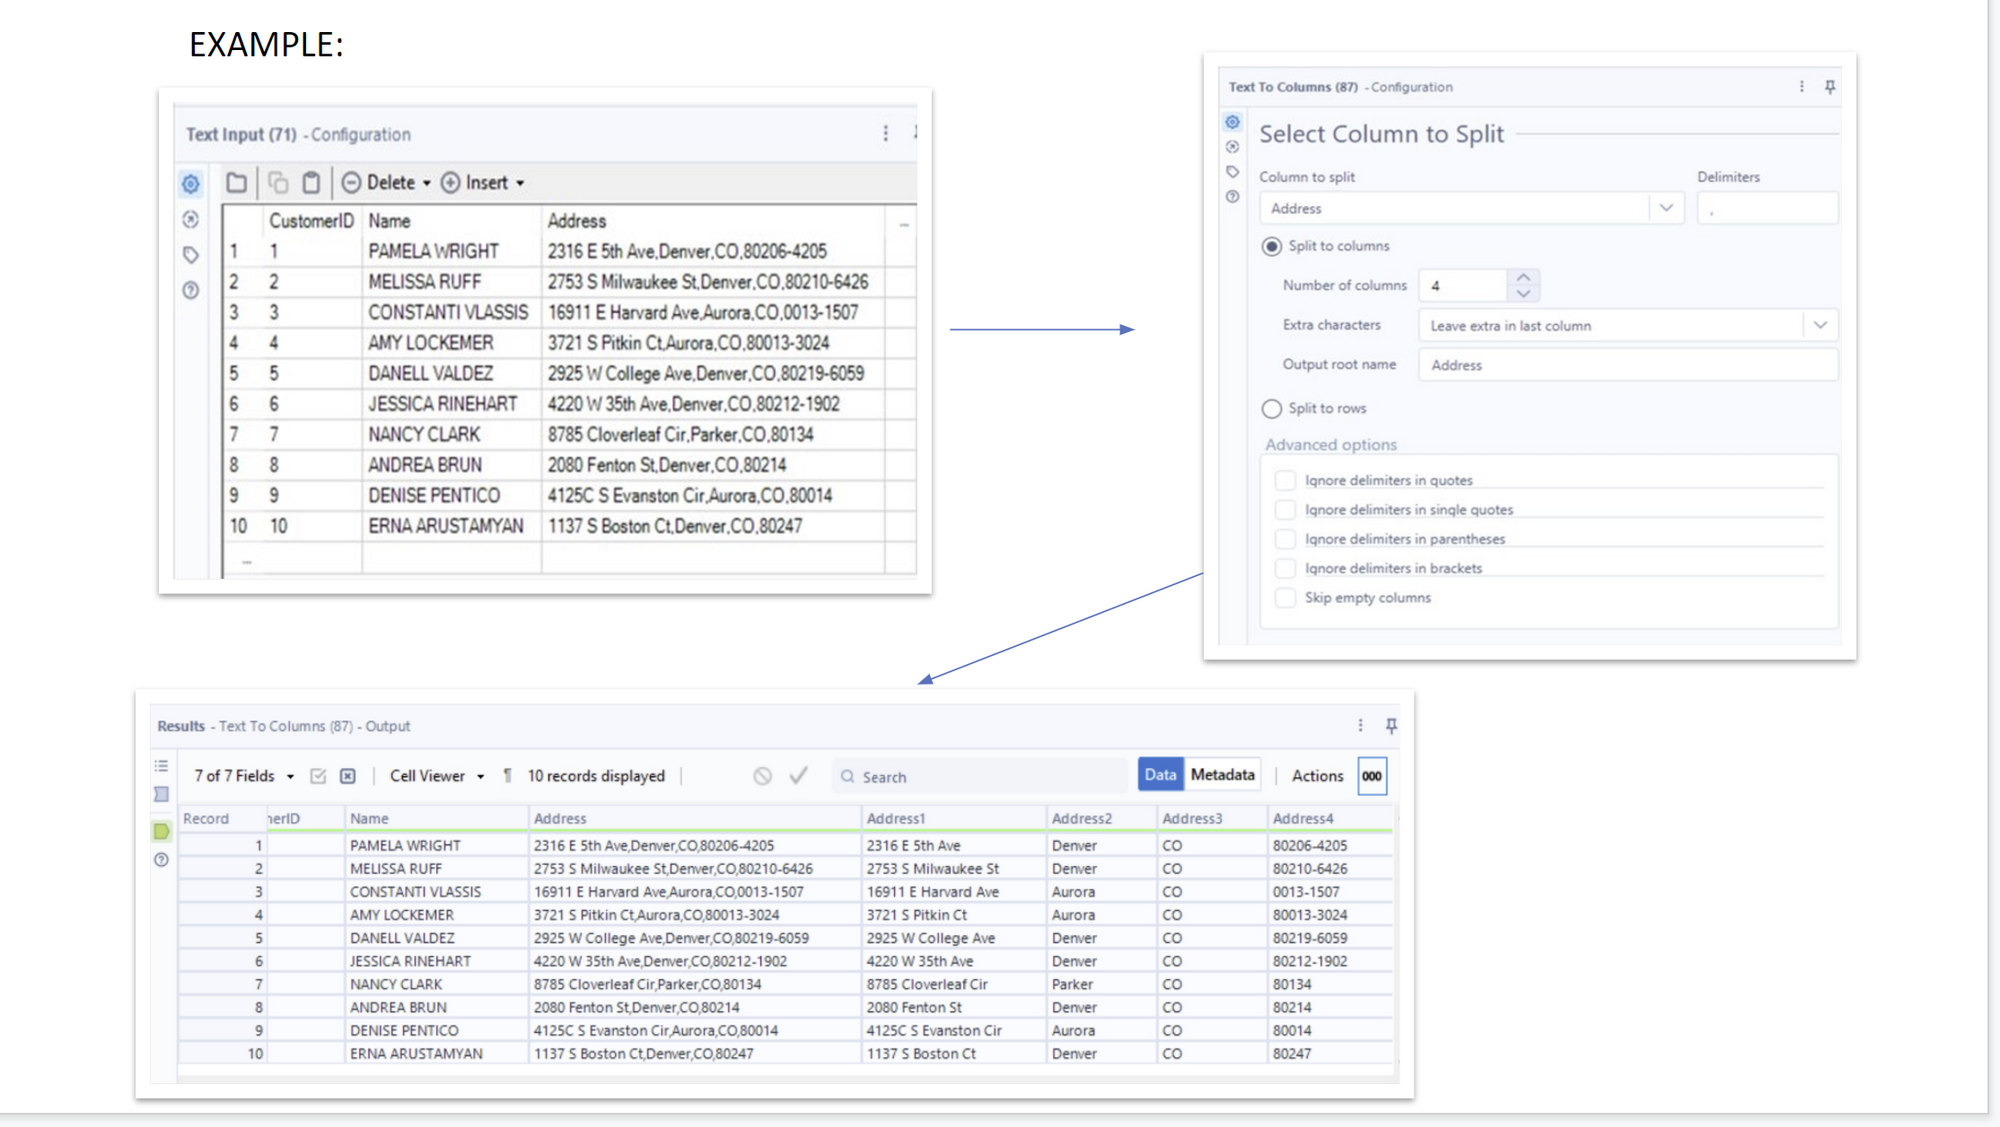
This tool is also a very simple tool which does exactly what it says it does. The Text to Columns tool splits the text from one column into separate rows or columns. It can be found in the 'Parse' tab. Below is an example of a column (address) which we would like to split into 4 separate columns to break down each part - address, city, state and postcode.

When the 'Text to Column' tool is attached to the workflow, the configuration in the top right of the example above is shown. Here we can decide which column we would like to split and how many columns we want to split it into. We can also decide which delimiter we would like to use to split the data, in this case a ',' was used. Some other tricks you can add to the delimiters are below.
Comment
The final tool that I demonstrated was the 'Comment' tool, which adds annotation to the workflow. It can be simply selected and dragged onto your workflow. In the example below, I added it into a tool container. Once the Comment tool is selected, the user can add in whatever annotation they would like.
