


Ranking in Tableau Prep helps organise data by assigning positions based on values. It is useful for identifying highest, lowest, first, or top-performing records within a dataset. Ranking also helps simplify filtering, grouping, and preparing data for analysis in Tableau.
Rank, Dense Rank, Percent Rank
In Tableau Prep, there are three different types of rank
| Value | Rank | Dense Rank | Percent Rank |
|---|---|---|---|
| 100 | 1 | 1 | 0% |
| 100 | 1 | 1 | 0% |
| 90 | 3 | 2 | 50% |
| 80 | 4 | 3 | 75% |
| 70 | 5 | 4 | 100% |
Rank
Assigns the same rank to identical values, and the next rank skips numbers accordingly. Useful for identifying positions while accounting for ties.
Example uses: Sales leaderboards, Competition standings, Employee performance rankings
Dense Rank
Useful for continuous ranking without gaps.
Identical values receive the same rank, but the next rank is not skipped. This creates cleaner sequential ordering.
Example uses: Product categorisation, Customer segmentation, Reporting and grouping analysis
Percent Rank
Useful for understanding relative performance within a dataset.
Instead of showing position numbers, it shows where a value stands as a percentage compared to all other records.
Example uses: Student percentile analysis, Customer spending percentiles, Benchmarking performance
Advantages vs Disadvantages of using Rank in Tableau Prep
Advantages
- Improved Performance: Rankings are calculated during data preparation, reducing calculations in dashboards and improving report performance.
- Cleaner and Simpler Dashboards: Precomputed ranking fields reduce the need for complex calculations in Tableau.
Disadvantages
- Less Dynamic: Rankings do not automatically update based on dashboard filters or user interactions.
- Requires Refreshing: The Prep flow must be rerun whenever the source data changes to recalculate rankings.
Example
Let’s say we want to calculate how much mobile data remains each month. We start with 100GB of data, and the monthly usage is consistently 10GB.
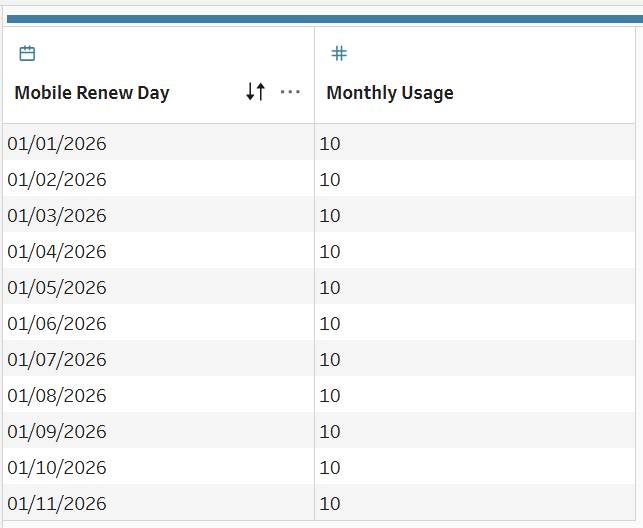
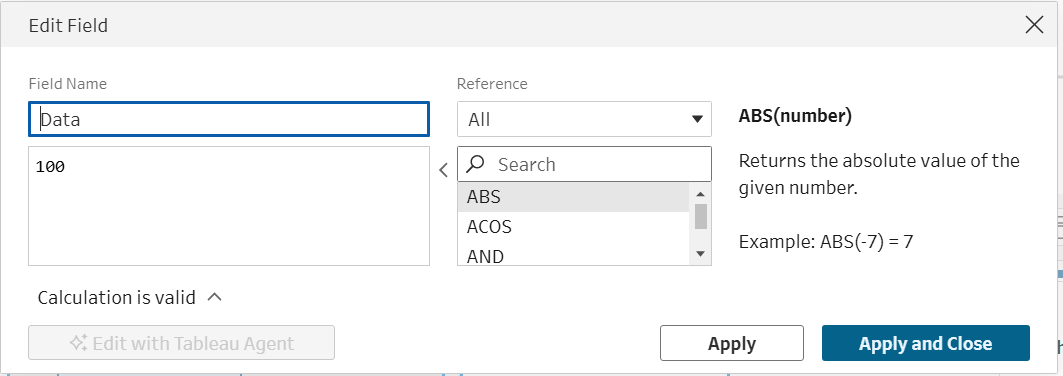
First create Data column that shows total available data.
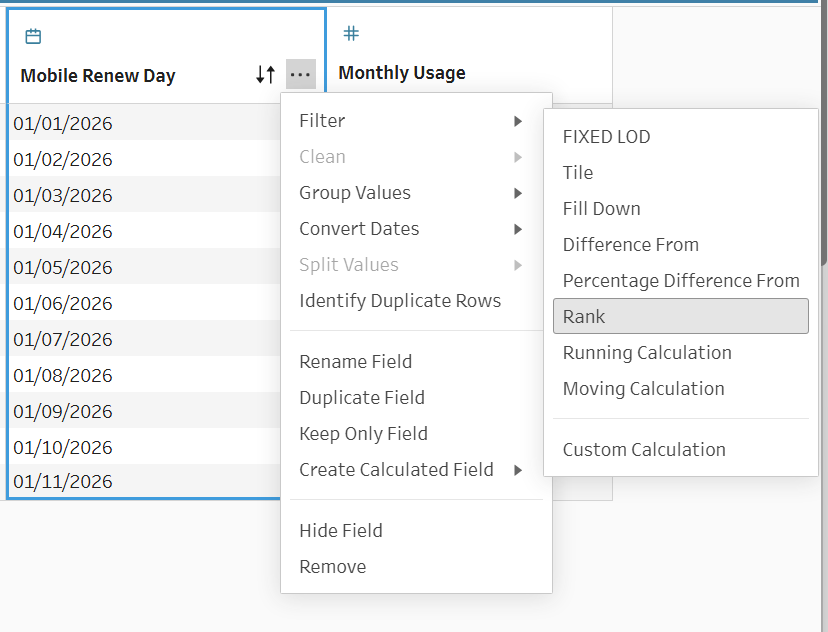
Then create Rank based on Mobile Renew Day
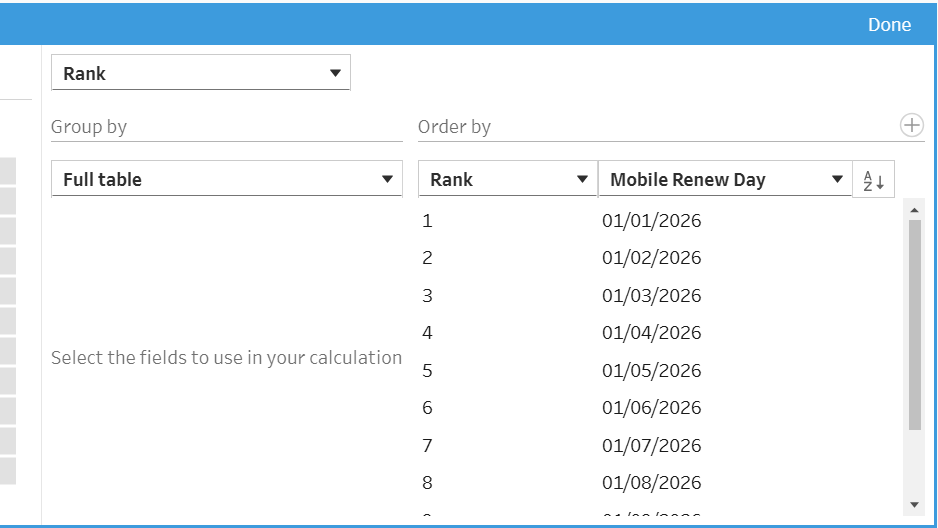
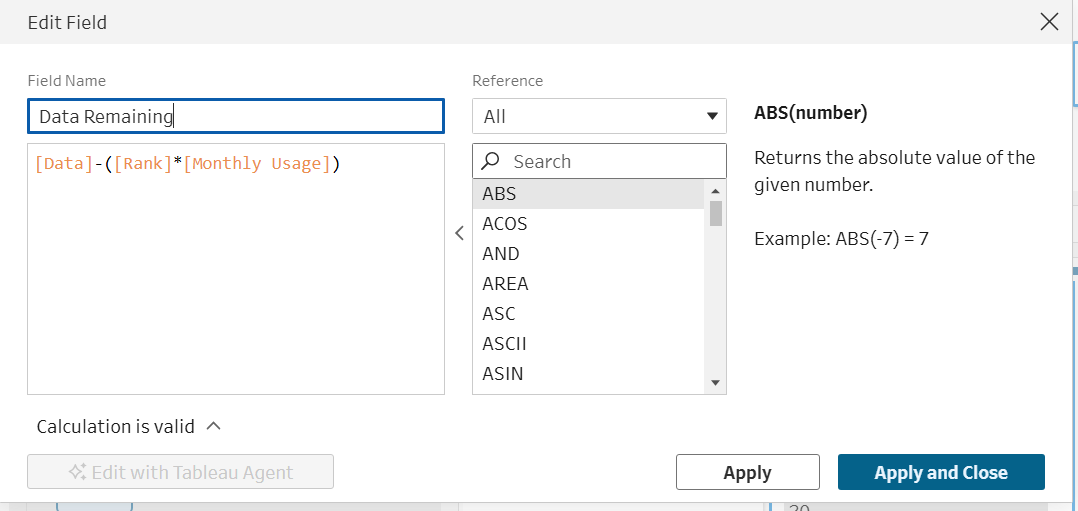
Create Data Remaining column
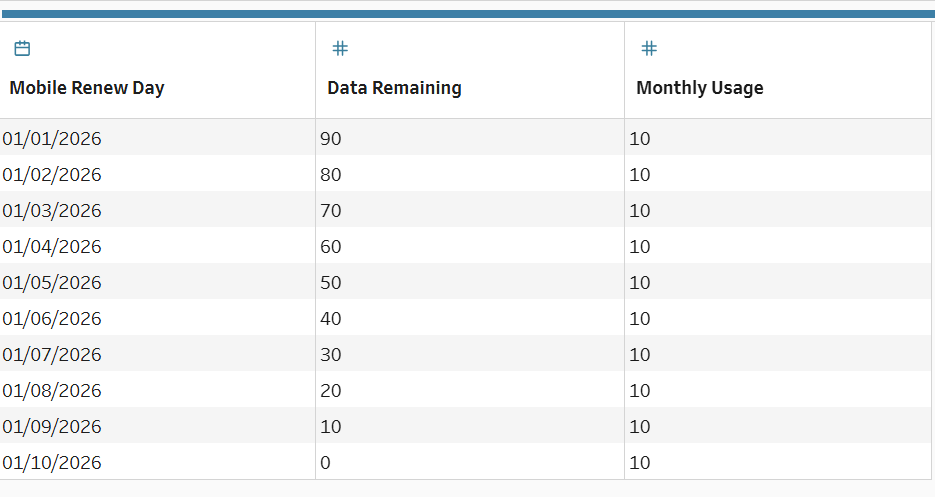
We’ll run out of mobile data by October.
Further Use Cases
- Trend Analysis: Compare how rankings change over time to identify growth or decline patterns.
- Monthly or Regional Comparisons: Rank records within groups such as month, category, or region to compare performance more effectively.
- Inventory Prioritisation: Rank products based on stock levels or sales frequency to support inventory management.
- Customer Loyalty Analysis: Rank customers by purchase frequency or lifetime value to identify loyal customers.