


For day 1 of dashboard week, DSNY5 was given survey data on Slovakain youths. The dataset contains information from the survey (mostly in a Likert scale of 1-5) concerning the preferences, interests, habits, opinions, and fears of young people.
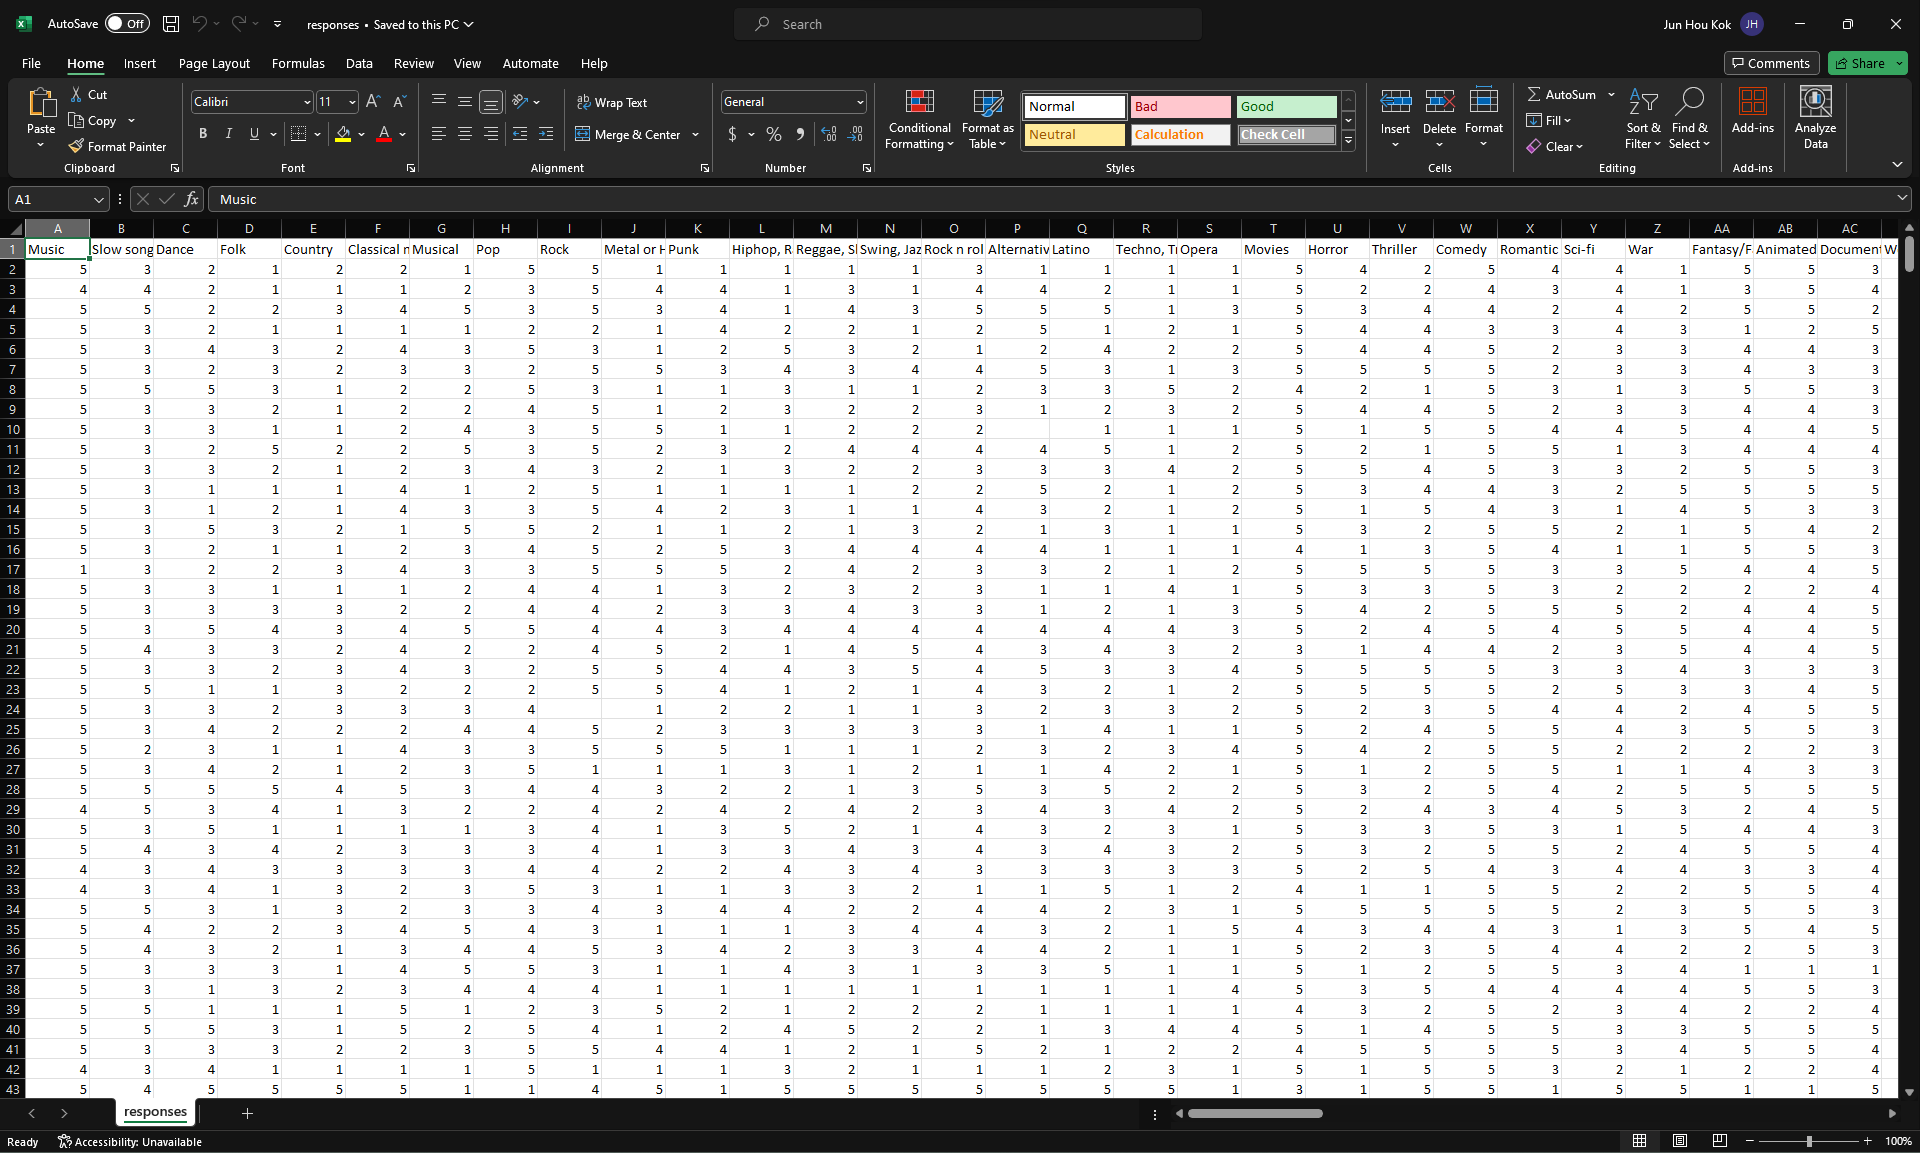
The survey data was presented this way, where each row of the data was a response from a survey taker. Alternatively, a data dictionary was also provided so that we could understand or join the tables together if needed.
The first step was to understand the data and see if there was a narrative I was able to highlight. The website that contained the data helped a lot in this process since it has a categorized of all the columns into separate themes.
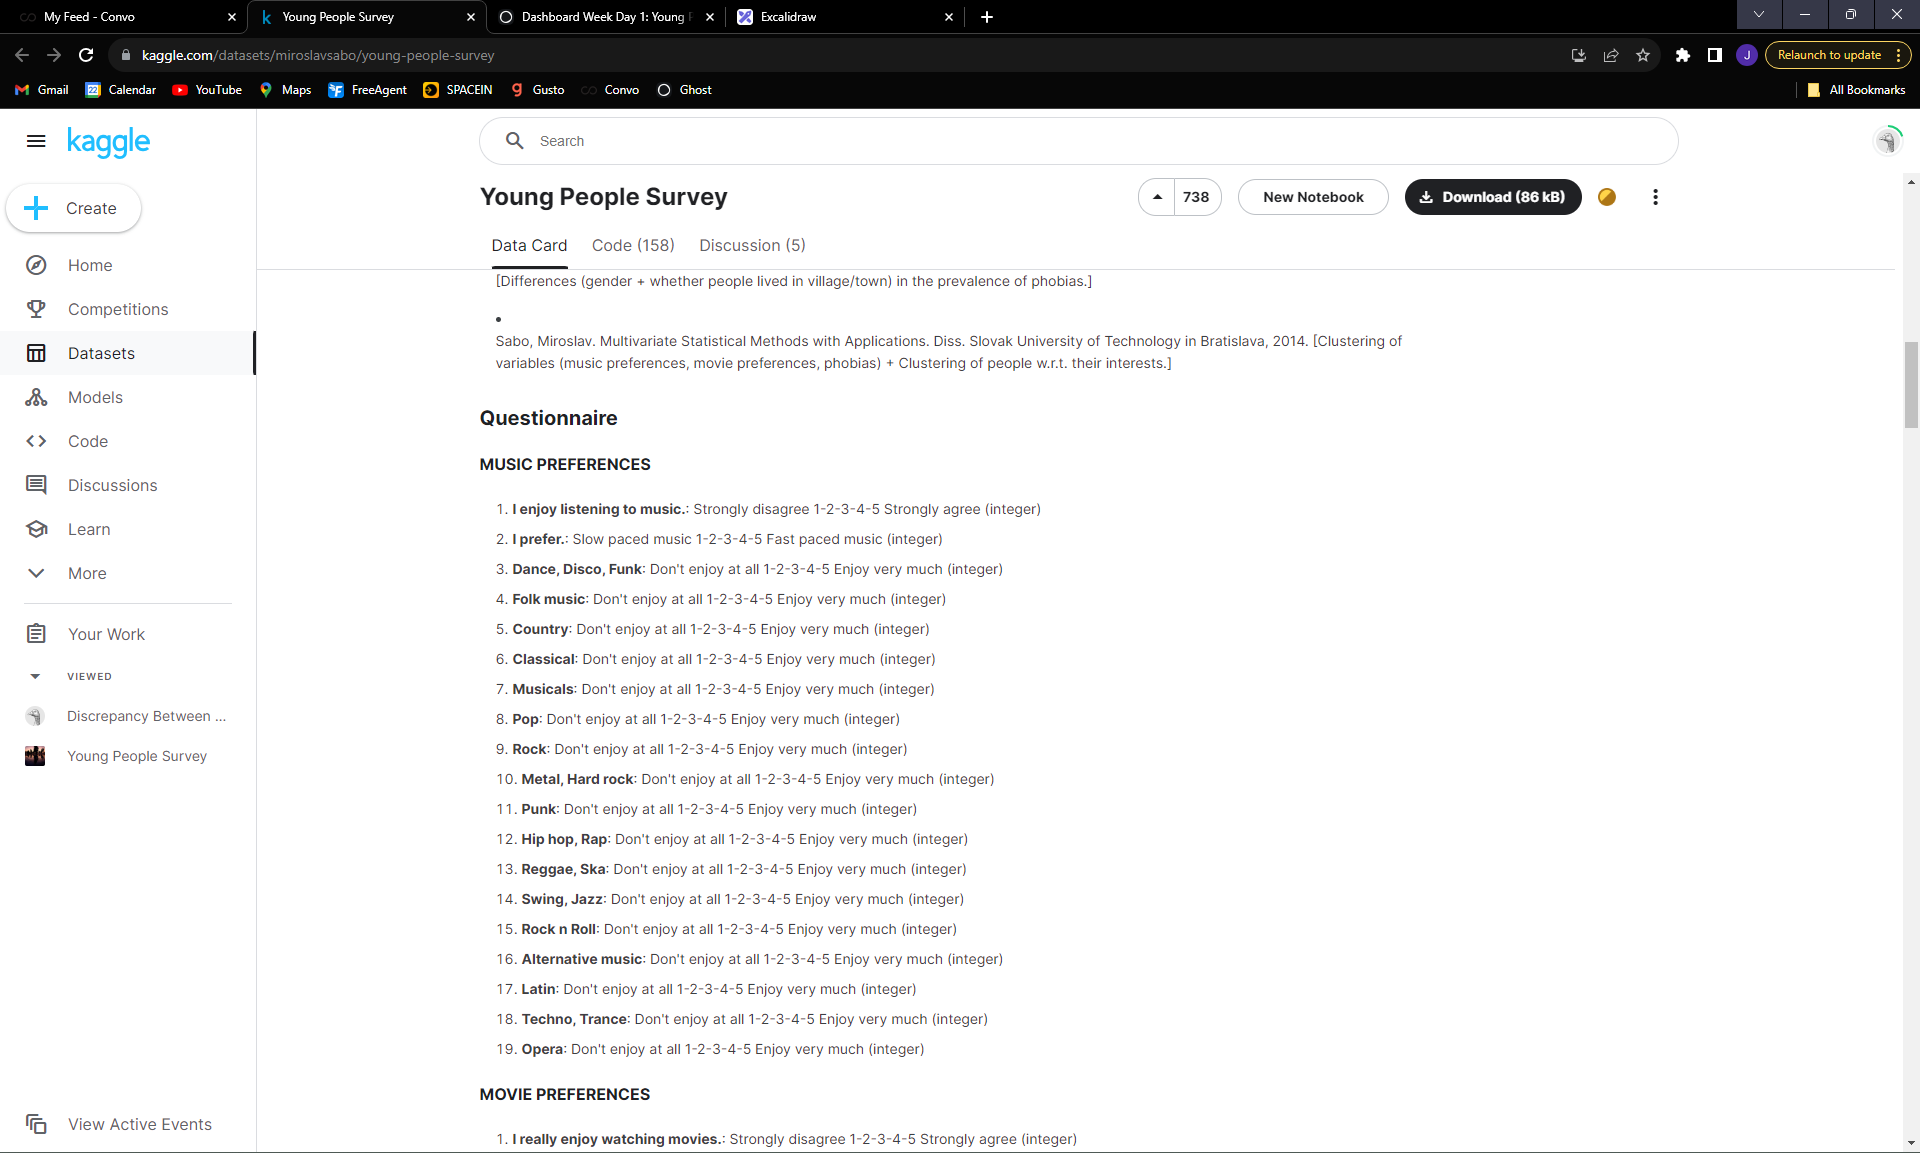
I was able to then focus on the question of "fear of ageing" as the main piece of my visualization. This opened many possibilities since there was a plethora of factors to stack this against to investigate correlations. With my main question in mind, how would the "fear of ageing" reflect on other scores of questions on the survey, I began the process of drafting my visualization.
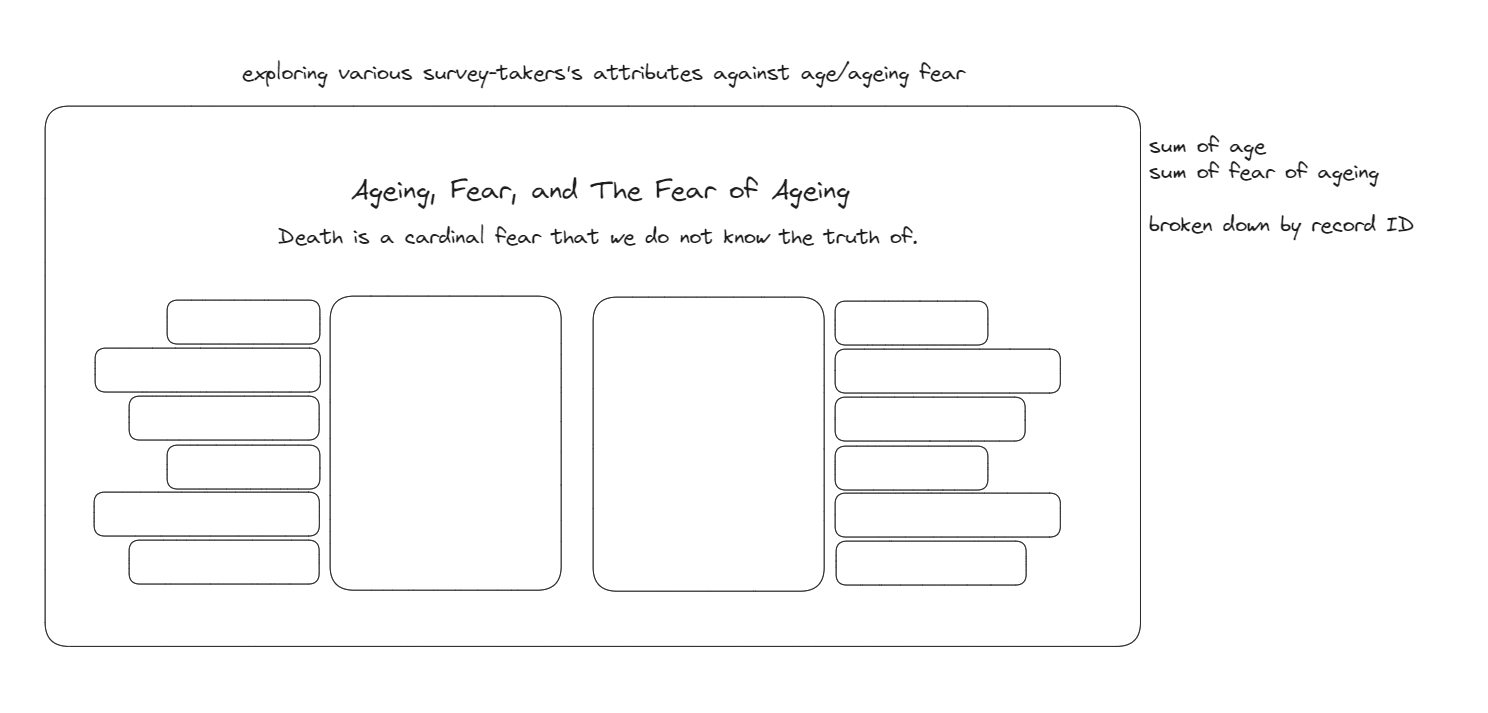
While having a draft ready meant that I had a lead into building out the visualization, it also gave me some problems as the survey was heavily skewed since most survey takers were among the 19-22 year old range. This then led me to pivot into building a different visualization that I had previously envisioned.
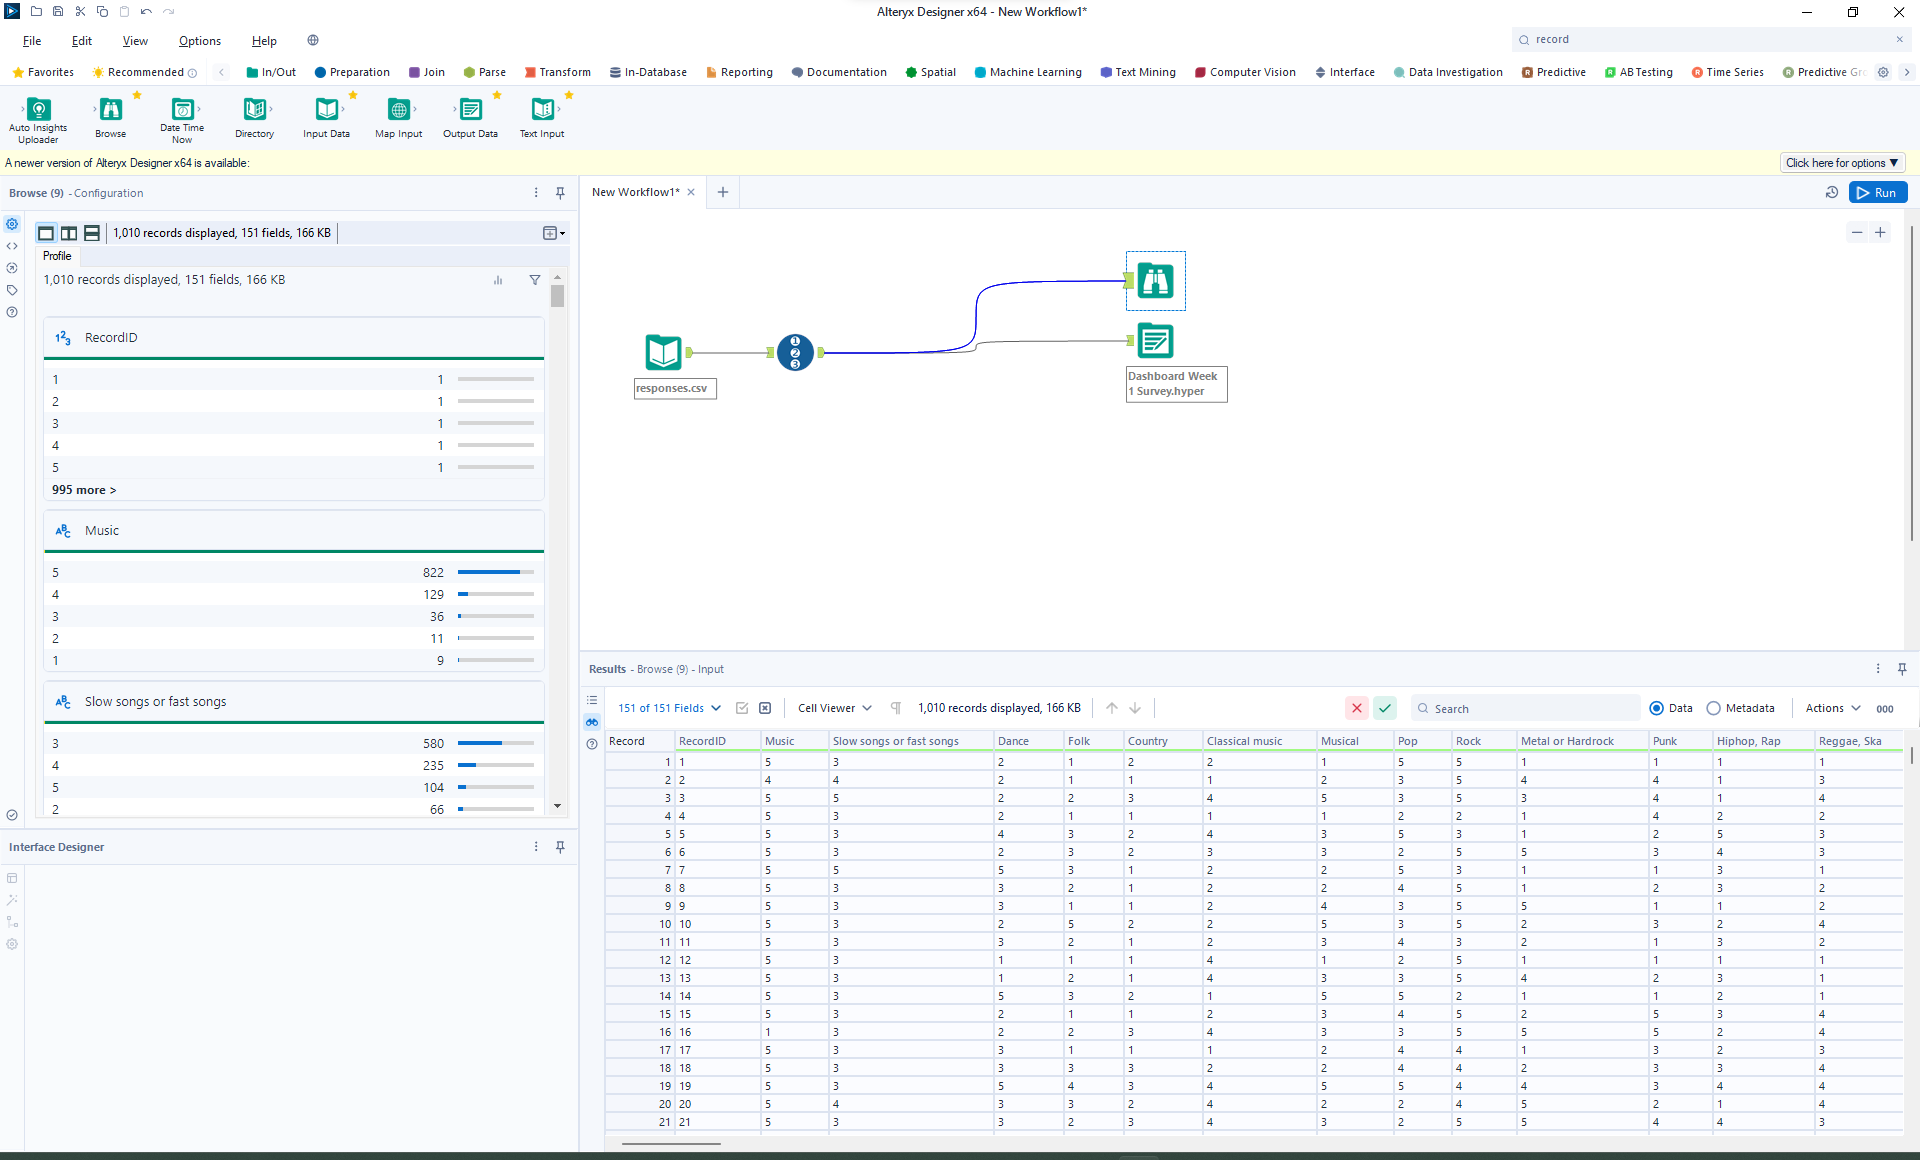
There was not much data prep needed for what I was going to do so I decided to only give each record a unique record ID using Alteryx.
I then decided to build a rank chart that showed how each score, given 1 =not worried about ageing, and 5= very worried about ageing.
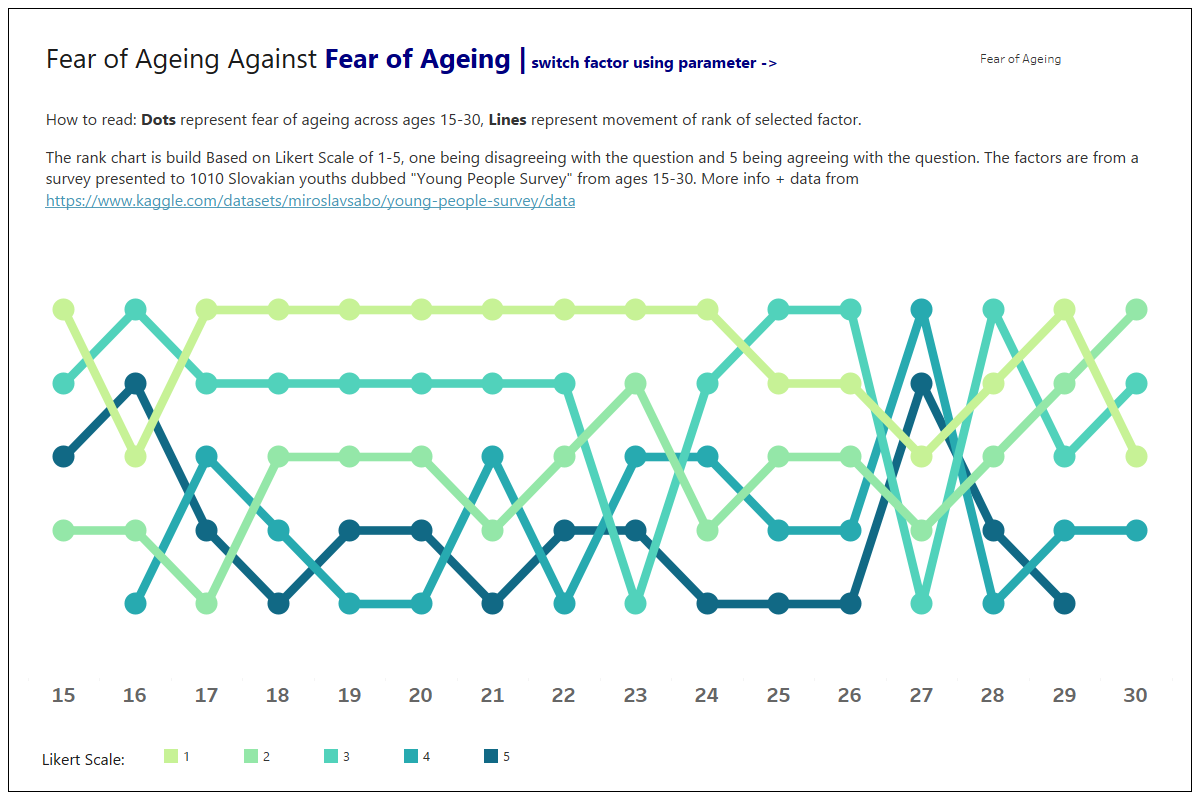
At the end I was able to finish my visualization that allowed the user to explore the correlation of the "Fear of Ageing" and other factors within the survey such as "Interest in Religion" and "Enjoyment of Music".