


Today our task was to use data from the ONS (https://www.ons.gov.uk/economy/inflationandpriceindices/articles/shoppingpricescomparisontool/2023-05-03?ref=thedataschool.co.uk). To analyse the change of price of shopping articles since 2018.
To start here was my plan for the day:
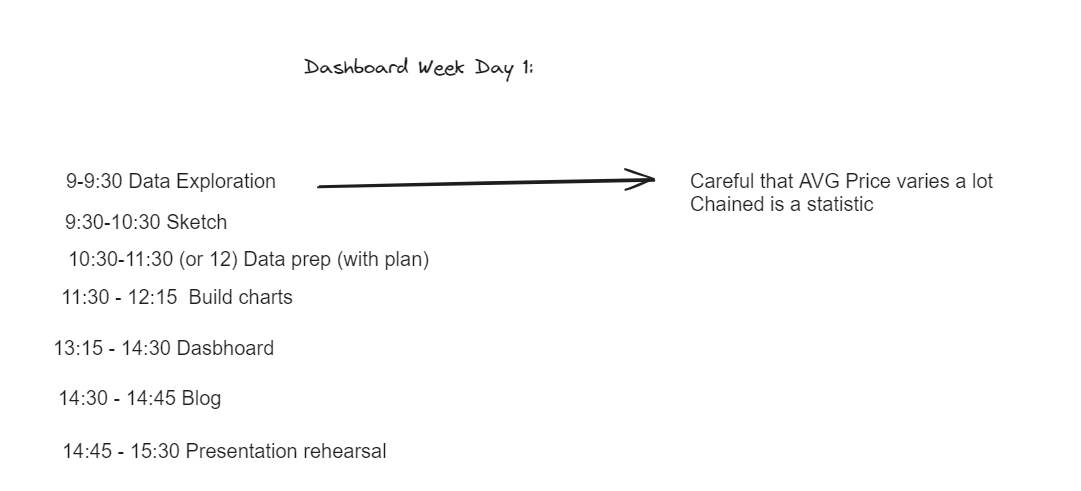
During data exploration I realised that AVG price was what I wanted to focus on. I learned about what chained indices were and decided not to use this or the percent different sheets as I could calculate that different myself. I spent more time trying to understand the hierarchy in the metadata to comprehend how I could utilise the items.
I then move to the sketch. During my data exploration I also noticed that TV prices were the ones heading the most down during the period of Jan 2018 to Oct 2023. I wanted to understand why. I had then moved on to more data discovery trying to find either of these datasets:
Streaming platform users
Manufacturing costs in tech
TV Licenses owned
Percentage of houseshares
This resulted in a lot of time and I therefore moved on to building my plan.
I wanted to show how price has decreased amongst the categories in which televisions were placed, therefore finding that televisions are the driver for these changes amongst the groups. This is what I planned to show this:
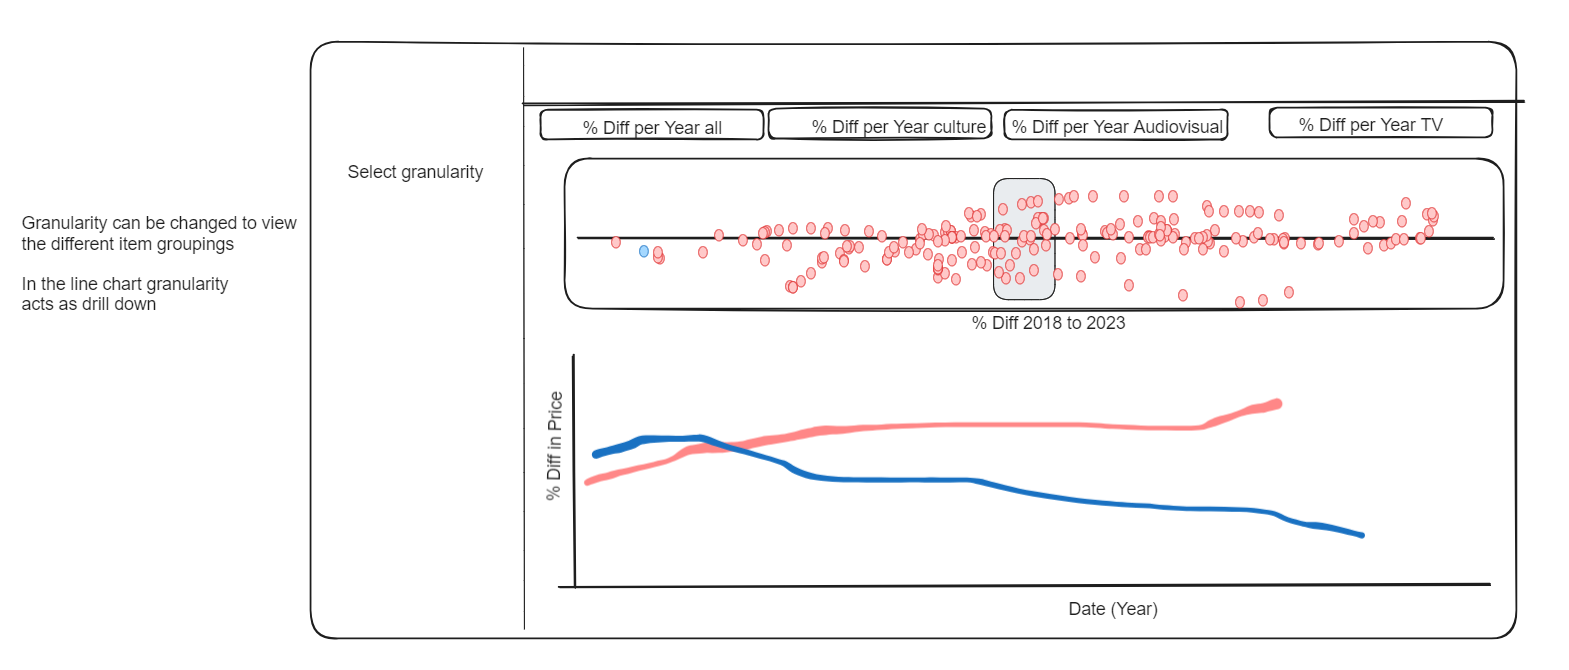
In terms of data preparation plan I first wanted to pivot all the fields which were dates in order to only have 3 columns in the AVG price sheet: Item ID, AVG price and Date. I then planned to join it to the metadata in order to know what the items were. Finally, I intentionally left the null values for earlier date when items did not exist in order to make it easier for myself to filter these items out when building my chart as they did not fit the timeframe I was interested in.
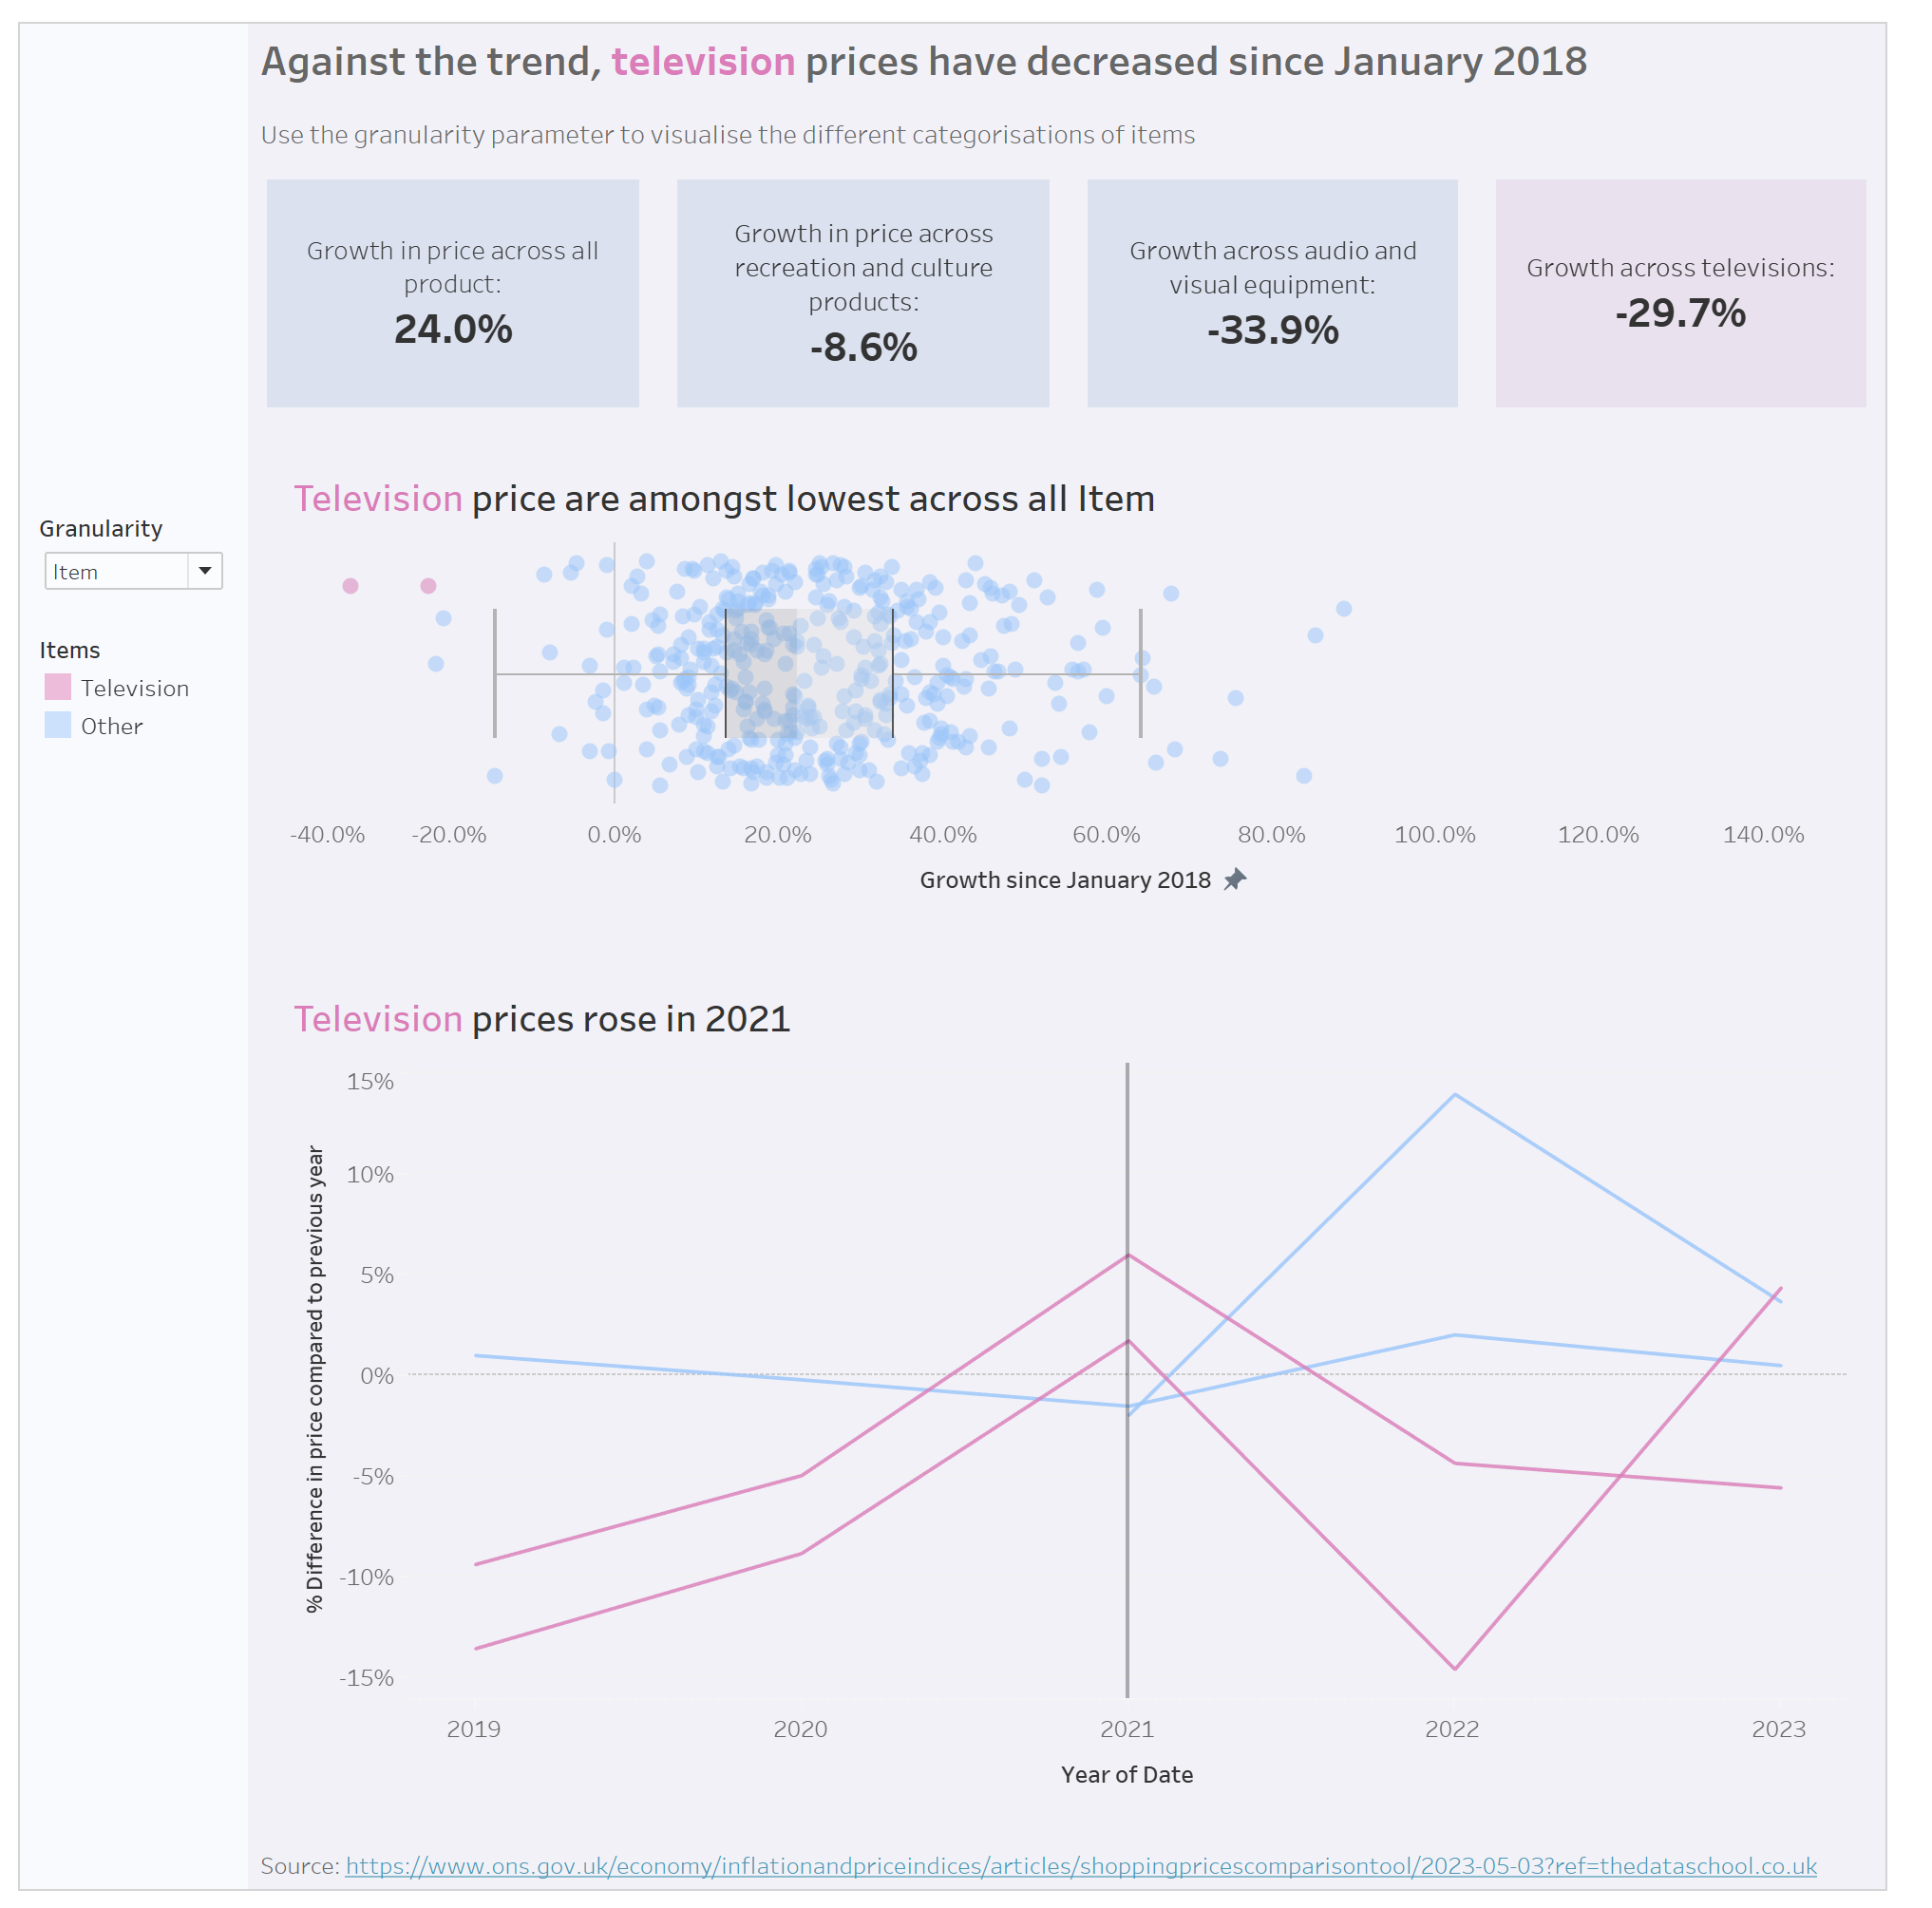
Here is the dashboard:
What I would like to do next:
Change the colour of the KPI based on the granularity selected, this would help for the context.
Add some new data to find out the why behind this price drop in TVs
What I take in for the rest of dashboard week:
Data exploration was key to me.
I'd like to go deeper into my analysis tomorrow.