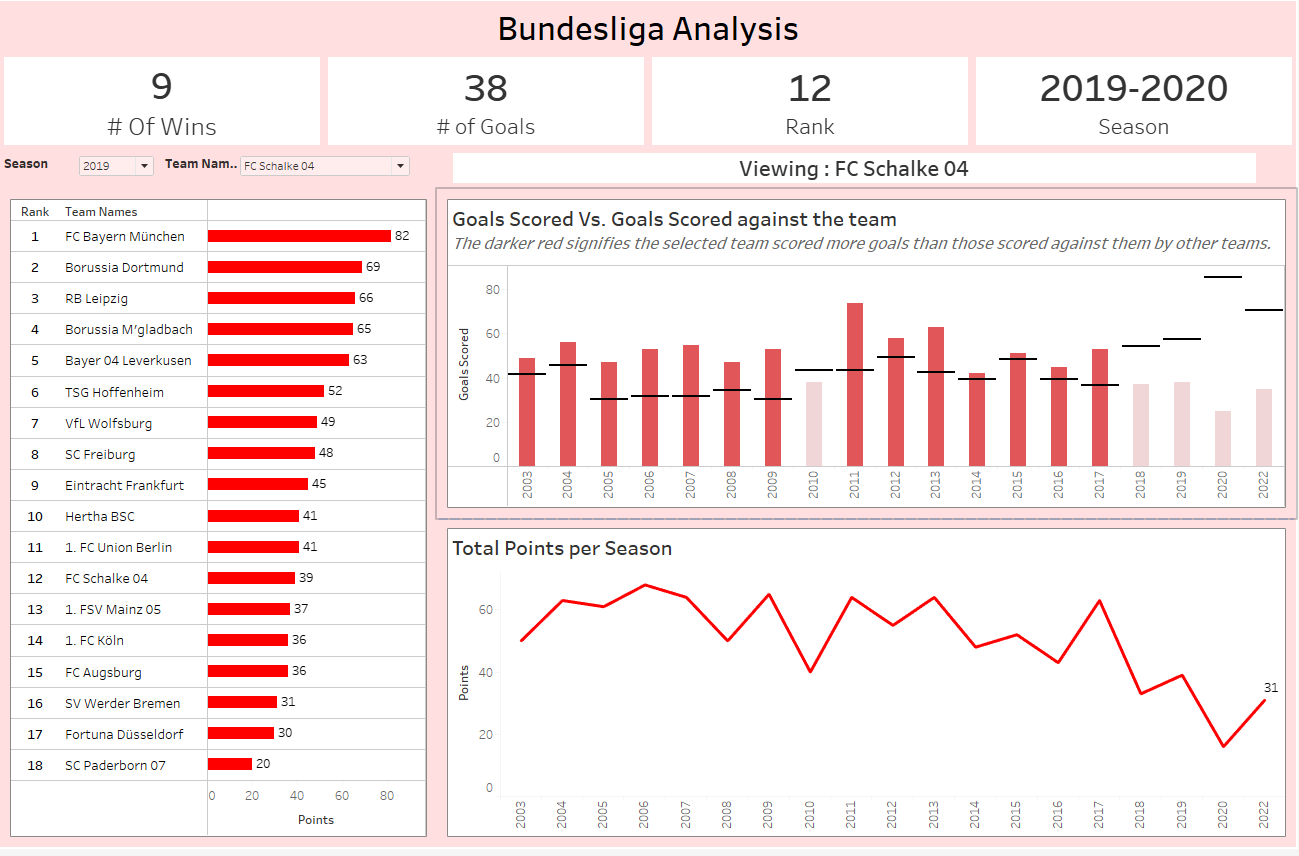
For this week, we were tasked with Web scraping a website, and with that information, we had to create an exploratory dashboard. Most of the morning was spent on obtaining the data, and to scrape the data, I used alteryx. Since one of the requirements was to obtain the data for the last 20 seasons, we had to create a batch macro to automate the process.
I first focused on creating an ALteryx Flow to obtain all the information I wanted for one year. After that work, I created the macro to obtain all 20 seasons of data.
My Alteryx flow for one season of data.

After implementing the macro, the end flow looks like this.
For the input, I have the seasons, and the batch macro takes the first season, pulls the information, then takes the second season and union that information to the first season, and then so on until the last season.
After obtaining the data, I began to analyze it and came up with an idea of what I wanted to base my dashboard on. After doing my sketch, I began building my dashboard, and I tried to make it exploratory, but due to time constraints, I couldn't implement everything I wanted to do. Therefore I focused on having a dashboard that gives information about a specific team and season.
This is the end result for the dashboard.

