Brief
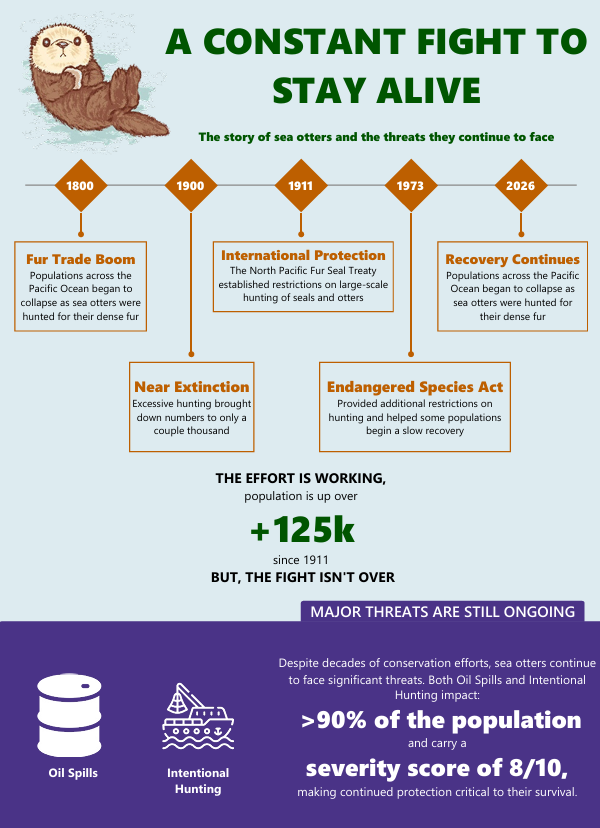
For today’s project, I was tasked with using an external API to gather data and create an infographic for an endangered species. I chose to focus on sea otters and the story of their ongoing fight for survival.
Plan
My initial plan was to explore the IUCN Red List API and determine what information was available for sea otters. I realized that there wasn’t much available data about figures over time, so to solve this problem, I incorporated external data in some areas.
Challenges
The biggest struggle today was working with the API; one small unnoticeable typo will cause the output to not work.