Brief
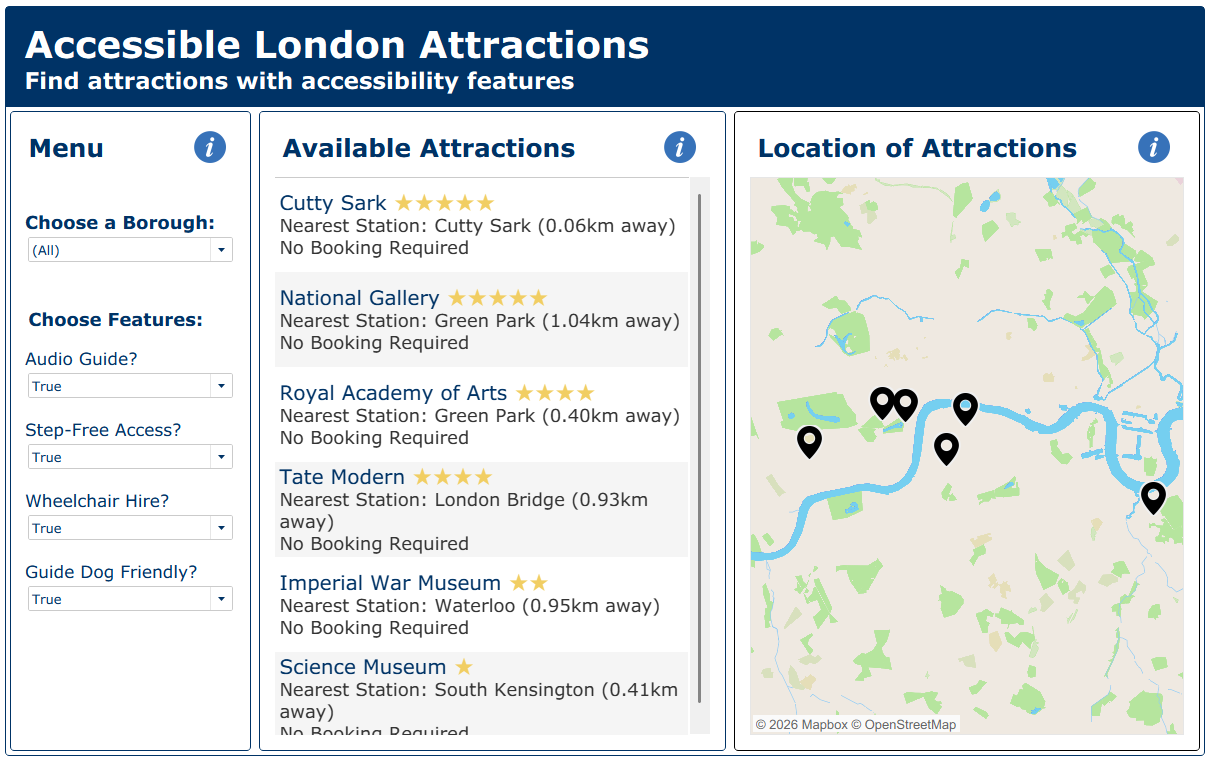
For this project, I was tasked with creating an accessible tourism dashboard for Chloe from the Mayor's Office. Chloe has been open about her dyslexia and dyscalculia. She finds most city planning dashboards overwhelming or unusable, particularly those filled with icons, percentages, and colors that blur together.
Plan & Final Product
My initial task was to focus on three of the main asks:
- Minimize cognitive overload (no heavy grid layouts or dense legends)
- Show rankings visually rather than numerically when possible
- Use plain English and icons with alt text
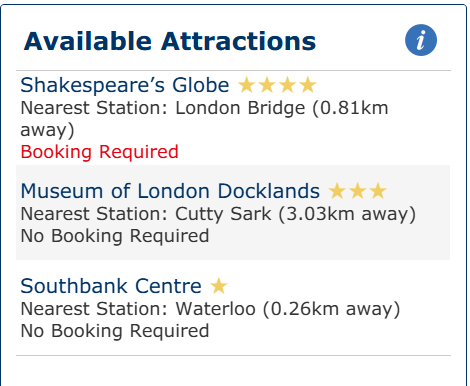
To address these requirements, I decided to create a simple attraction ranking system, even though a ranking was not included in the original dataset. The purpose of the ranking was not to measure accessibility, but rather to provide Chloe with an easy way to compare and navigate through attractions. I assigned each attraction a rating from one to five stars, creating a familiar and intuitive visual that users can quickly understand. Because Chloe has dyscalculia and may find numerical comparisons challenging, I chose to display the rankings using stars instead of numeric scores.
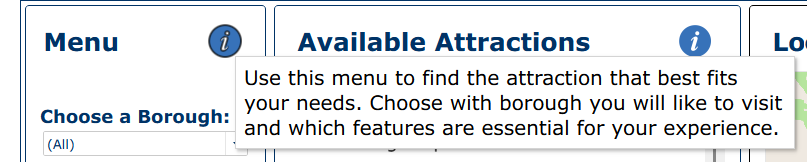
Additionally, I incorporated information icons throughout the dashboard that provide short explanatory tooltips when hovered over. This allowed me to remove excessive instructional text from the dashboard while still ensuring users could understand how to interact with each section when needed.
I also included a booking indicator for each attraction, as users may be searching for places to visit soon and need to quickly understand whether advance planning is required. To make this information stand out, I used color strategically to highlight attractions that require booking. While Chloe noted that dashboards can become overwhelming when colors blend together or are overused, color can still be an effective accessibility tool when applied with a clear purpose