


Tired of having to drag floating charts around? Frustrated when you have to re-scale every single thing inside a dashboard if you change the canvas size? I know I was during my application process.
Fear not, there is a better way.
Welcome to the world of containers.
What are containers?
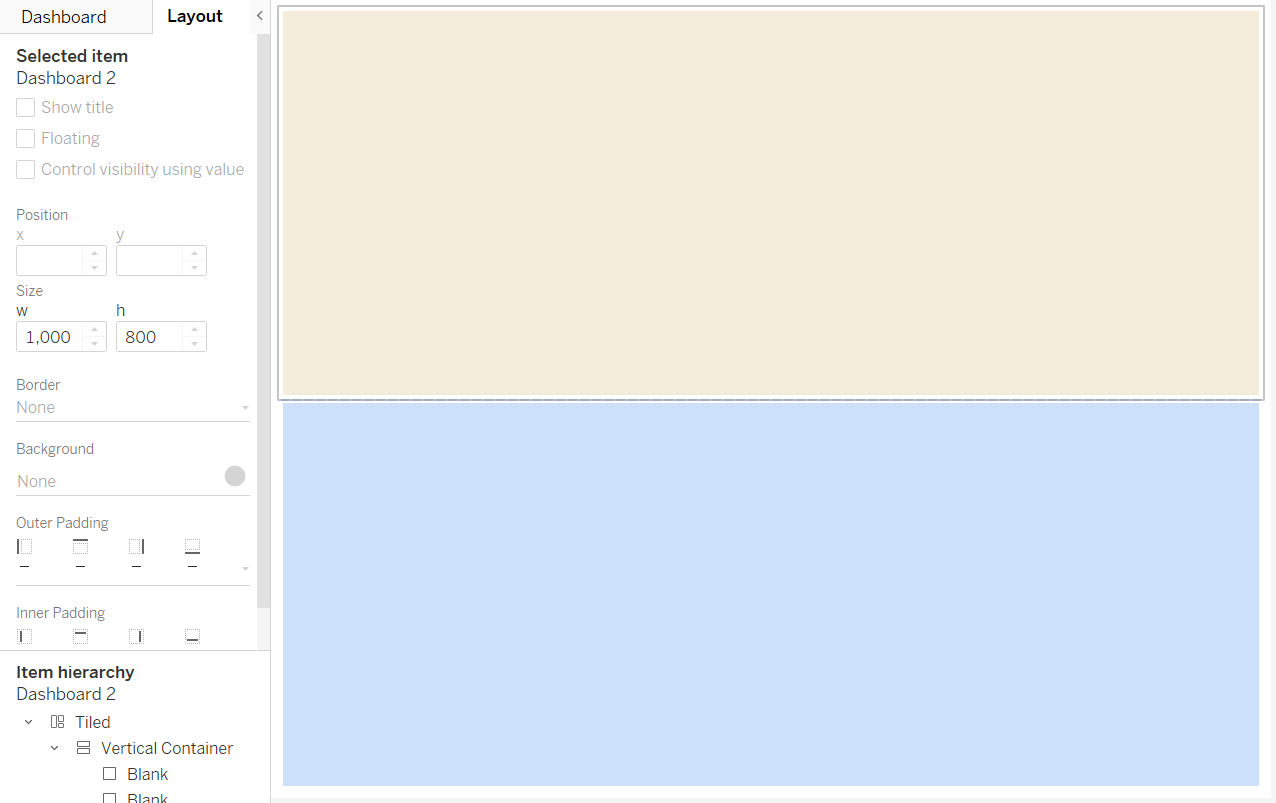
Containers are invisible layout objects used to organize and group other dashboard components. There are two kinds: vertical and horizontal. This refers to the way the different elements inside the container will stack.
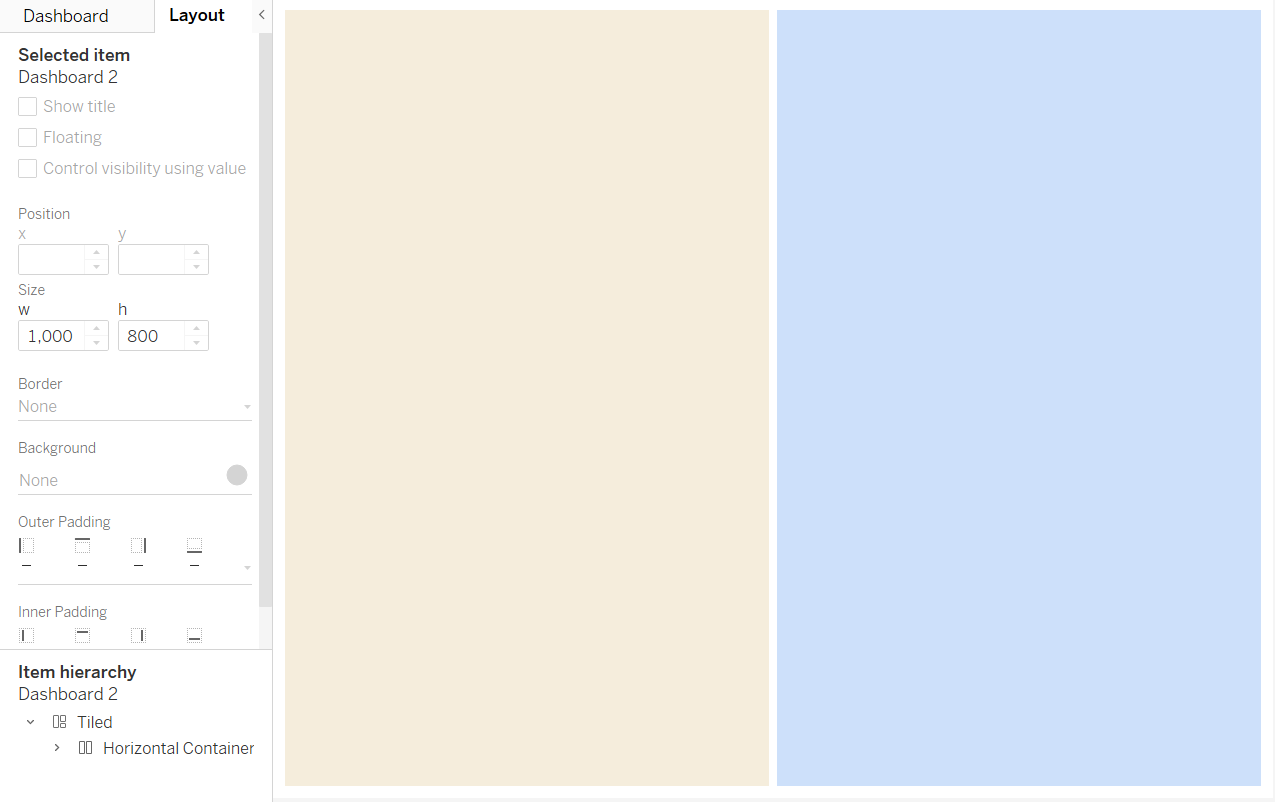
You can nest containers inside one another, allowing you to plan out how your viz will look (and what containers will be needed to house the different elements) and then build your dashboard without having to painstakingly scale each chart relative to the others.
General Tips
I like to start with a floating container which you can scale to the size of the canvas.
Once you've created a container, it's a good idea to drag one or more blank objects into it so that you can access it later in the hierarchy and to ensure the layout is as expected (note: be careful dragging objects near the edges - can cause the container to swap between vertical and horizontal).
You can easily distribute the contents of a container evenly as shown in the gif below.
Now that we know what containers are and some general tips, let's see how they might be used!
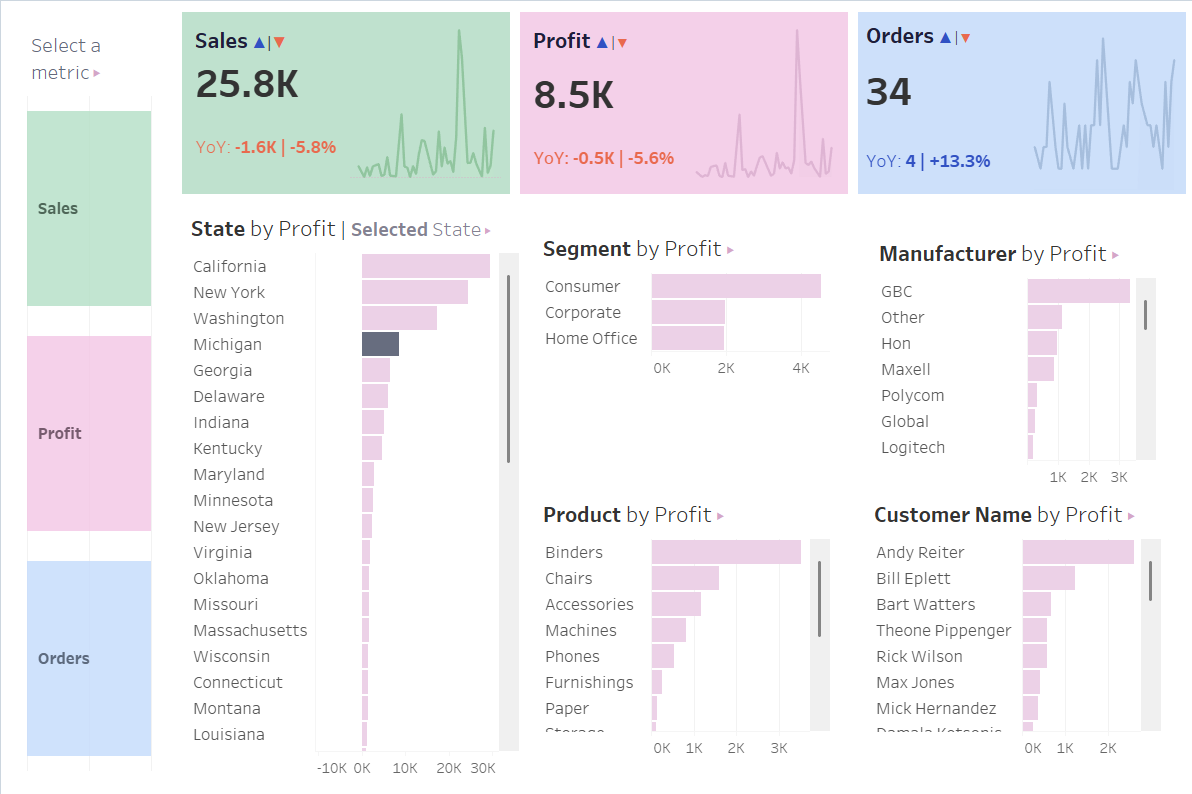
Here's a dashboard that we assembled using the Sample - Superstore data in one of our classes.
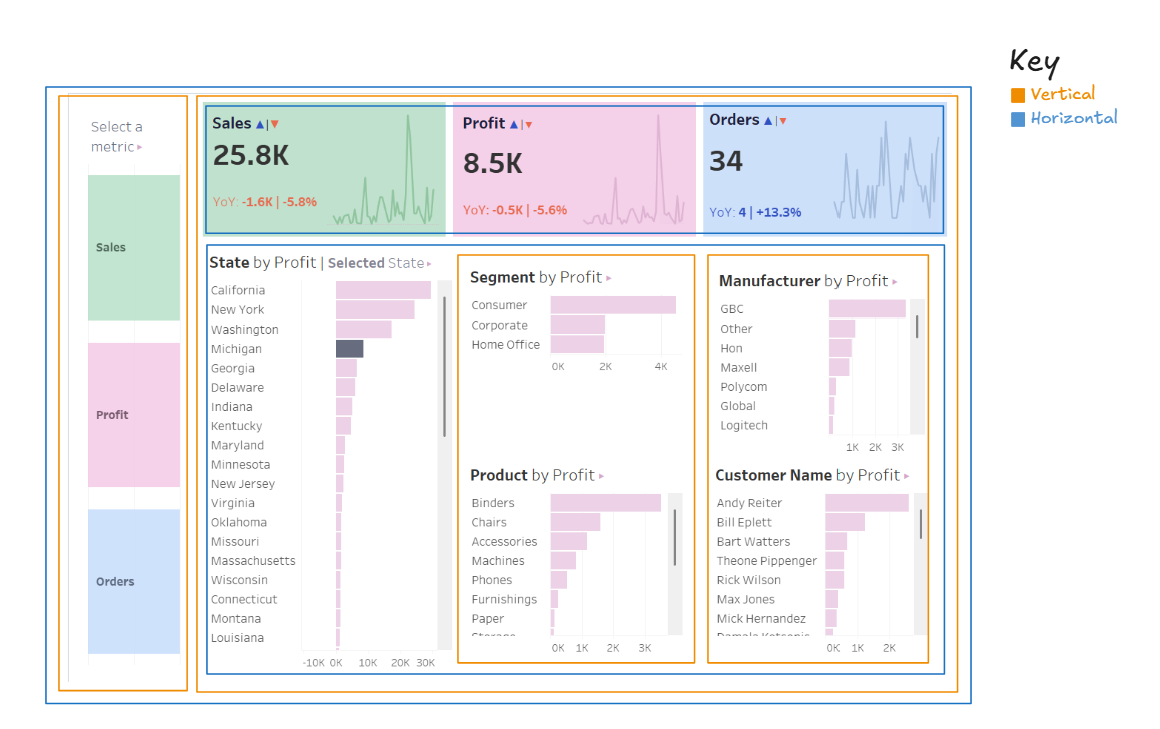
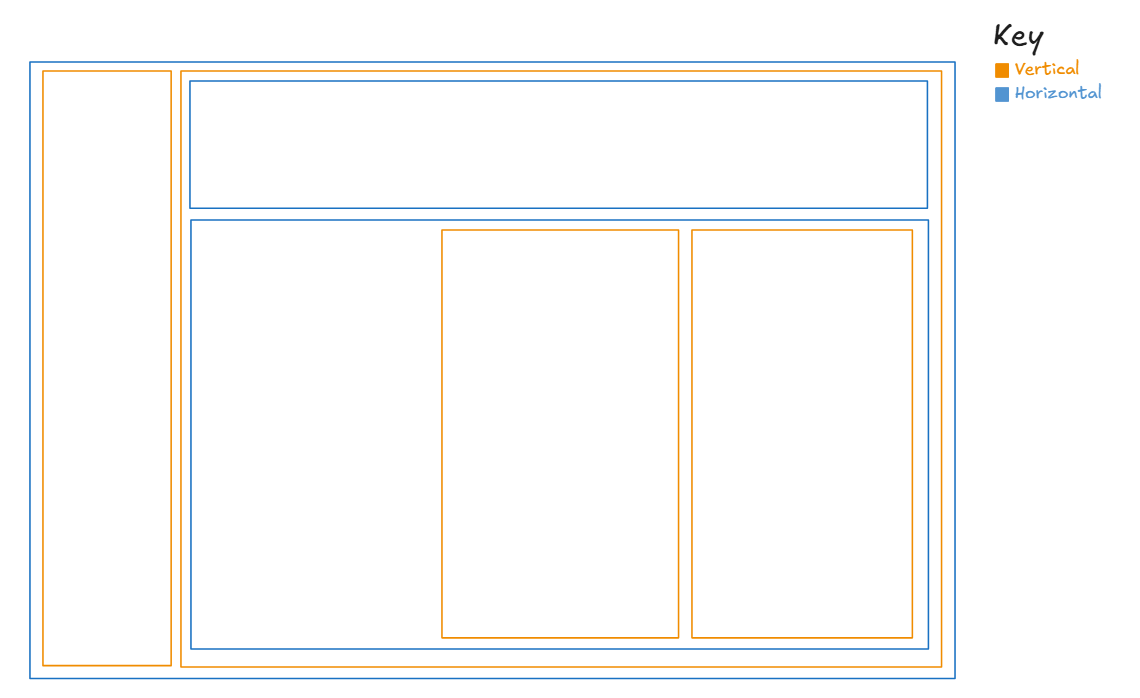
Let's have a look at how the containers making this visual can be broken down.
Hopefully this has been a useful introduction on containers in Tableau. They can be tricky to master, but are a powerful tool once you get to grips with them.